PROJECTS
VELA
About Vela ↑
Vela is a UX/UI case study of a responsive web app that was designed over a period of 6 months, from July 2022 to January 2023, with myself as the sole UX Designer. It was designed to provide simple, straightforward marine weather reports to users of all levels.
Why Vela?
Sailors, surfers, and beachgoers alike all need a way to easily find and understand the weather condition of their favorite spot. Vela's goal is to make sure that everyone is able to make the most out of each day on the water, by providing accurate and reliable data, easy-to-read weather reports, and around the world service.
Vela also provides a way to save favorite locations, create weather itineraries for trips, keep aware of water and weather safety issues in locations, and discover and communicate with rental and tour companies.
Research ↑
During the discovery phase, I conducted an analysis of both the competitive environment and my potential userbase.
5 people were interviewed to learn what water sports people commonly took part in, when and where they did these activities, what kind of weather data was needed, and how to best display the information. With the interview, I was able to start to identify a rough profile of common needs, frustrations, and desires to shape the form of the app.
Key Takeaways
Users want to see that data is frequently updated, so they know they can trust it.
Visual data that can be understood at a glance is key! Some users are interested in viewing exact numbers and charts, but there was an unanimous interest in visual representations of data.
Due to time and geographic constraints, users primarily enjoy sports during vacation. Many of them are interested in traveling to different locations to surf or sail.
Different safety concerns take priority depending on the sport. Users who aren't in a boat, like swimmers, scuba divers, or surfers, are more concerned about dangers in the water itself, while boat users are more concerned about weather changes.
The main thing users are concerned about when they get ready to go out is information about the wind. It's the most difficult thing for casual users to judge themselves, and they rely on apps for it the most.
Most apps on the market tend to be specific or fragmented in purpose, with specialized information in only one sport or area of weather. There's opportunity in creating a weather app that hosts a range of weather information, is simple to understand, and provides extra information about a location (such as what the seabed is like, local dangers and hazards, etc), in order to target more casual users who don't often have expertise in these areas.
Ideation ↑
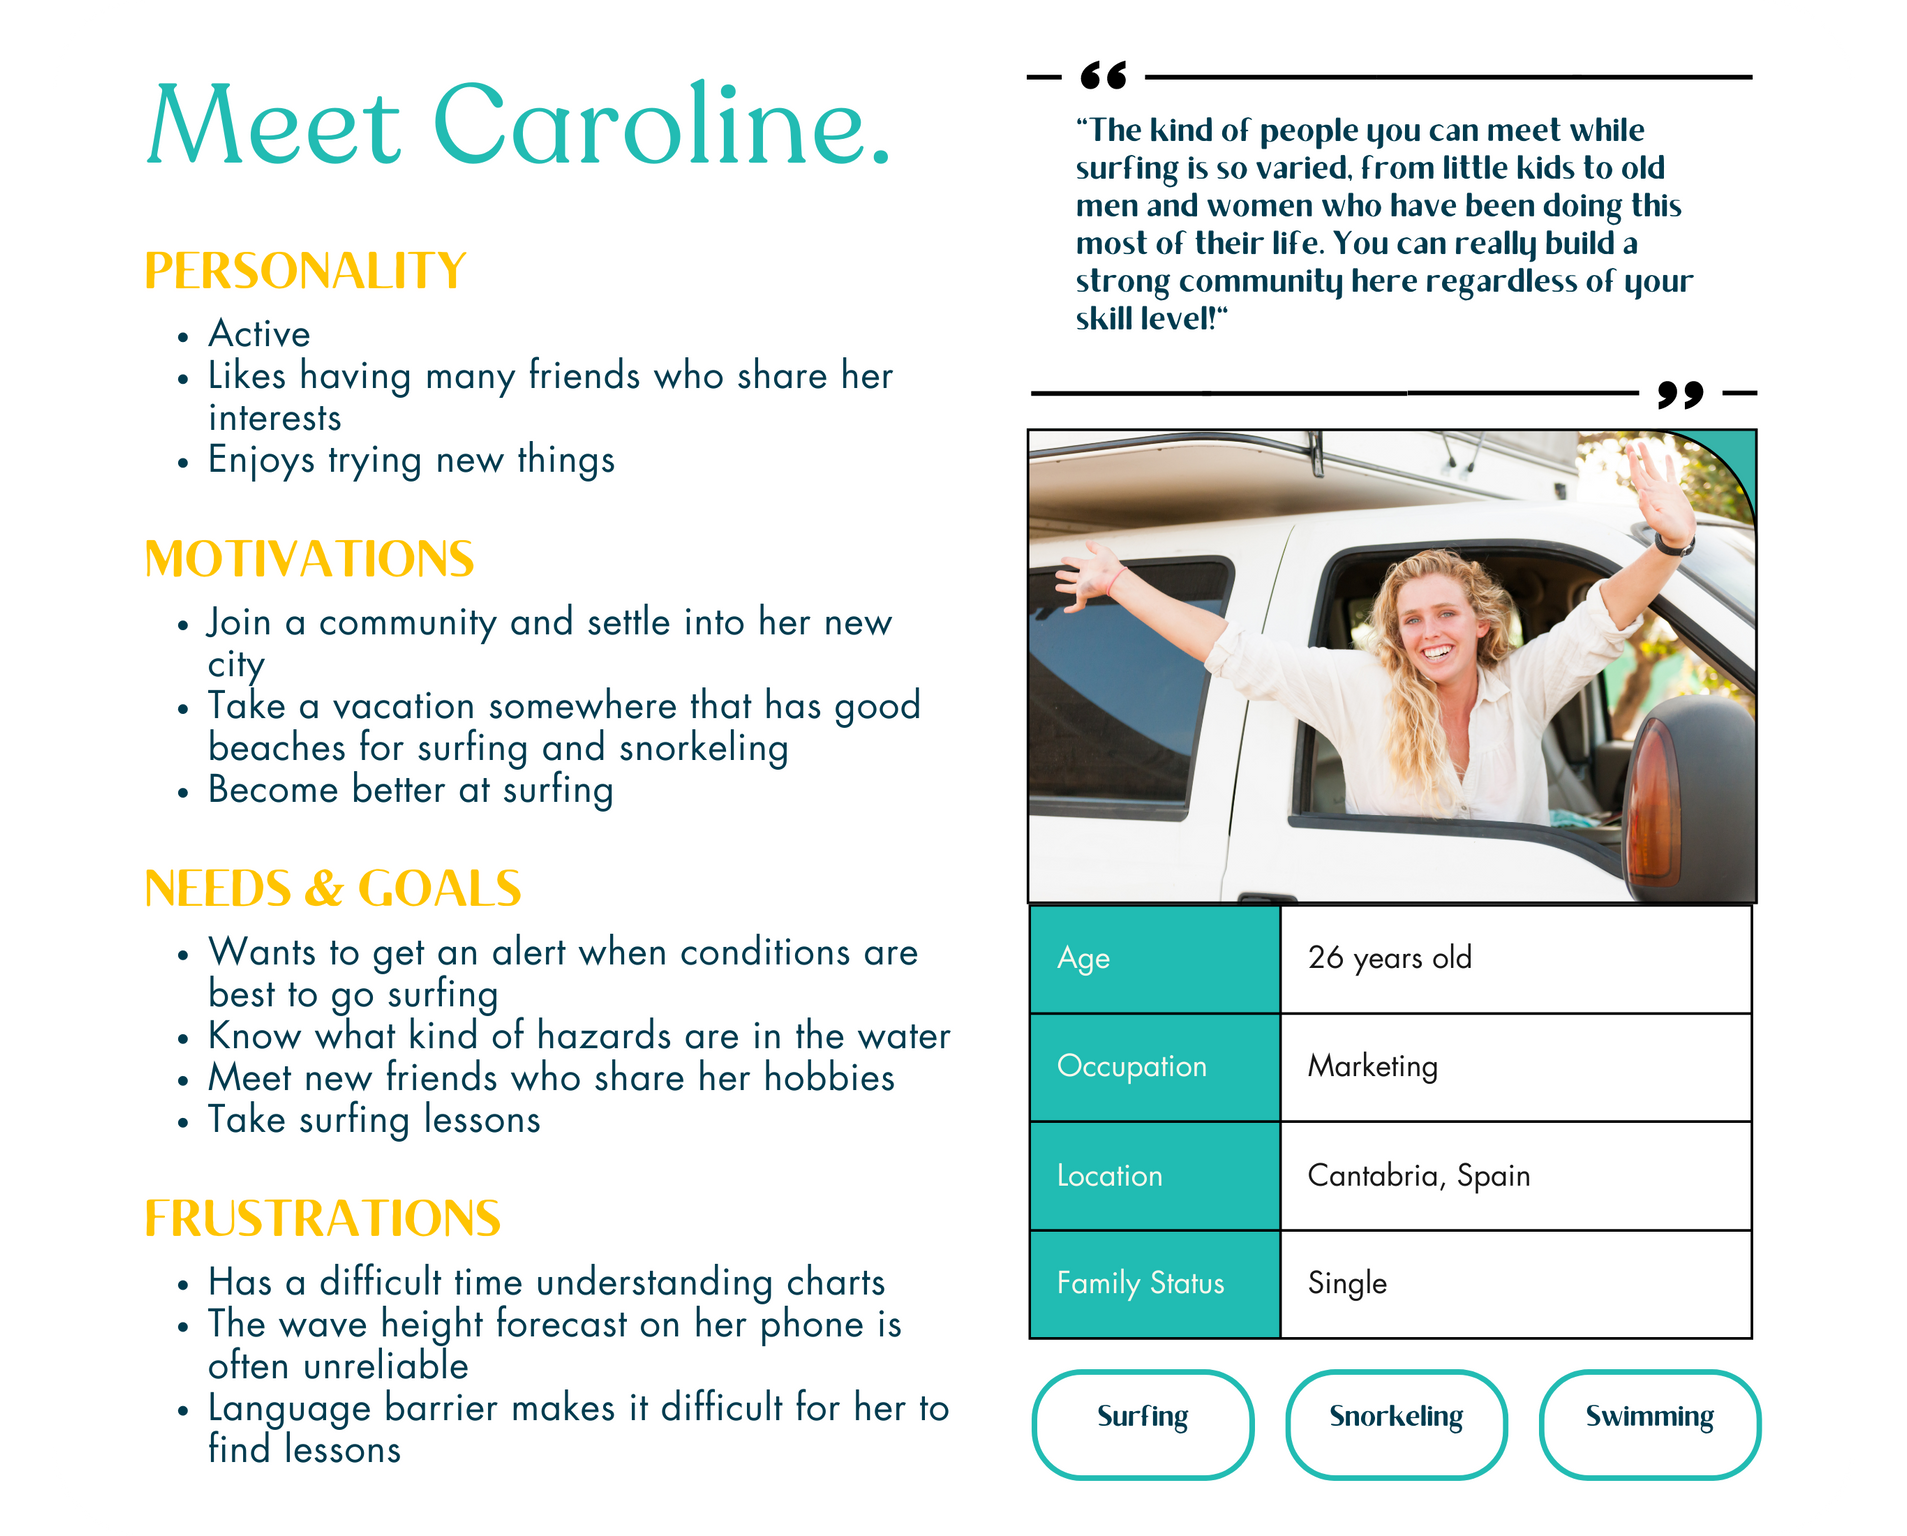
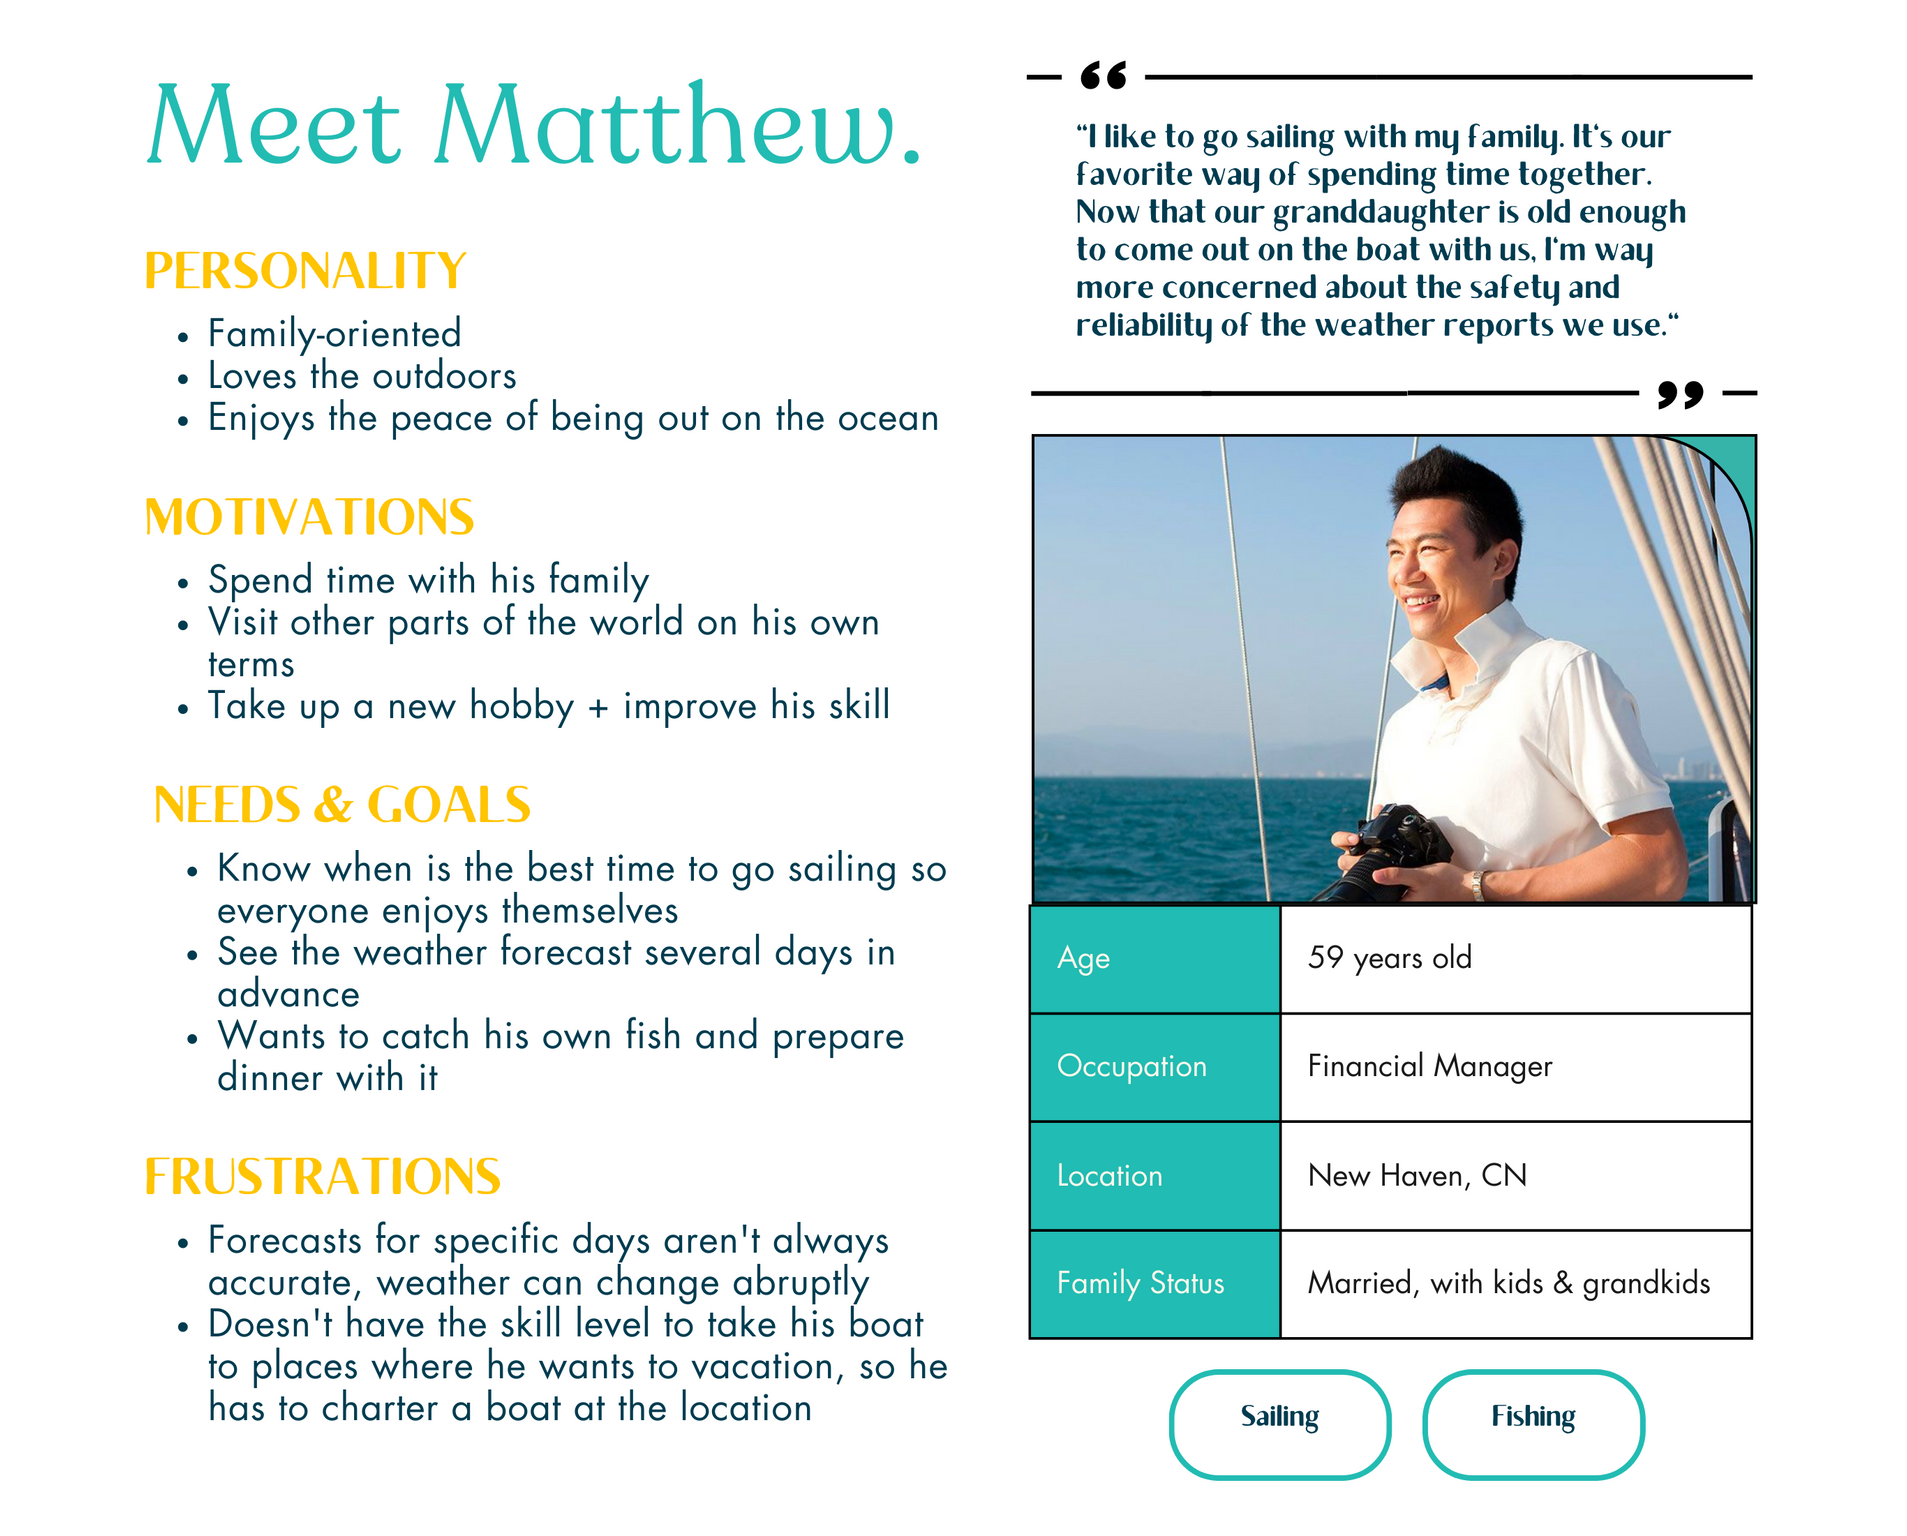
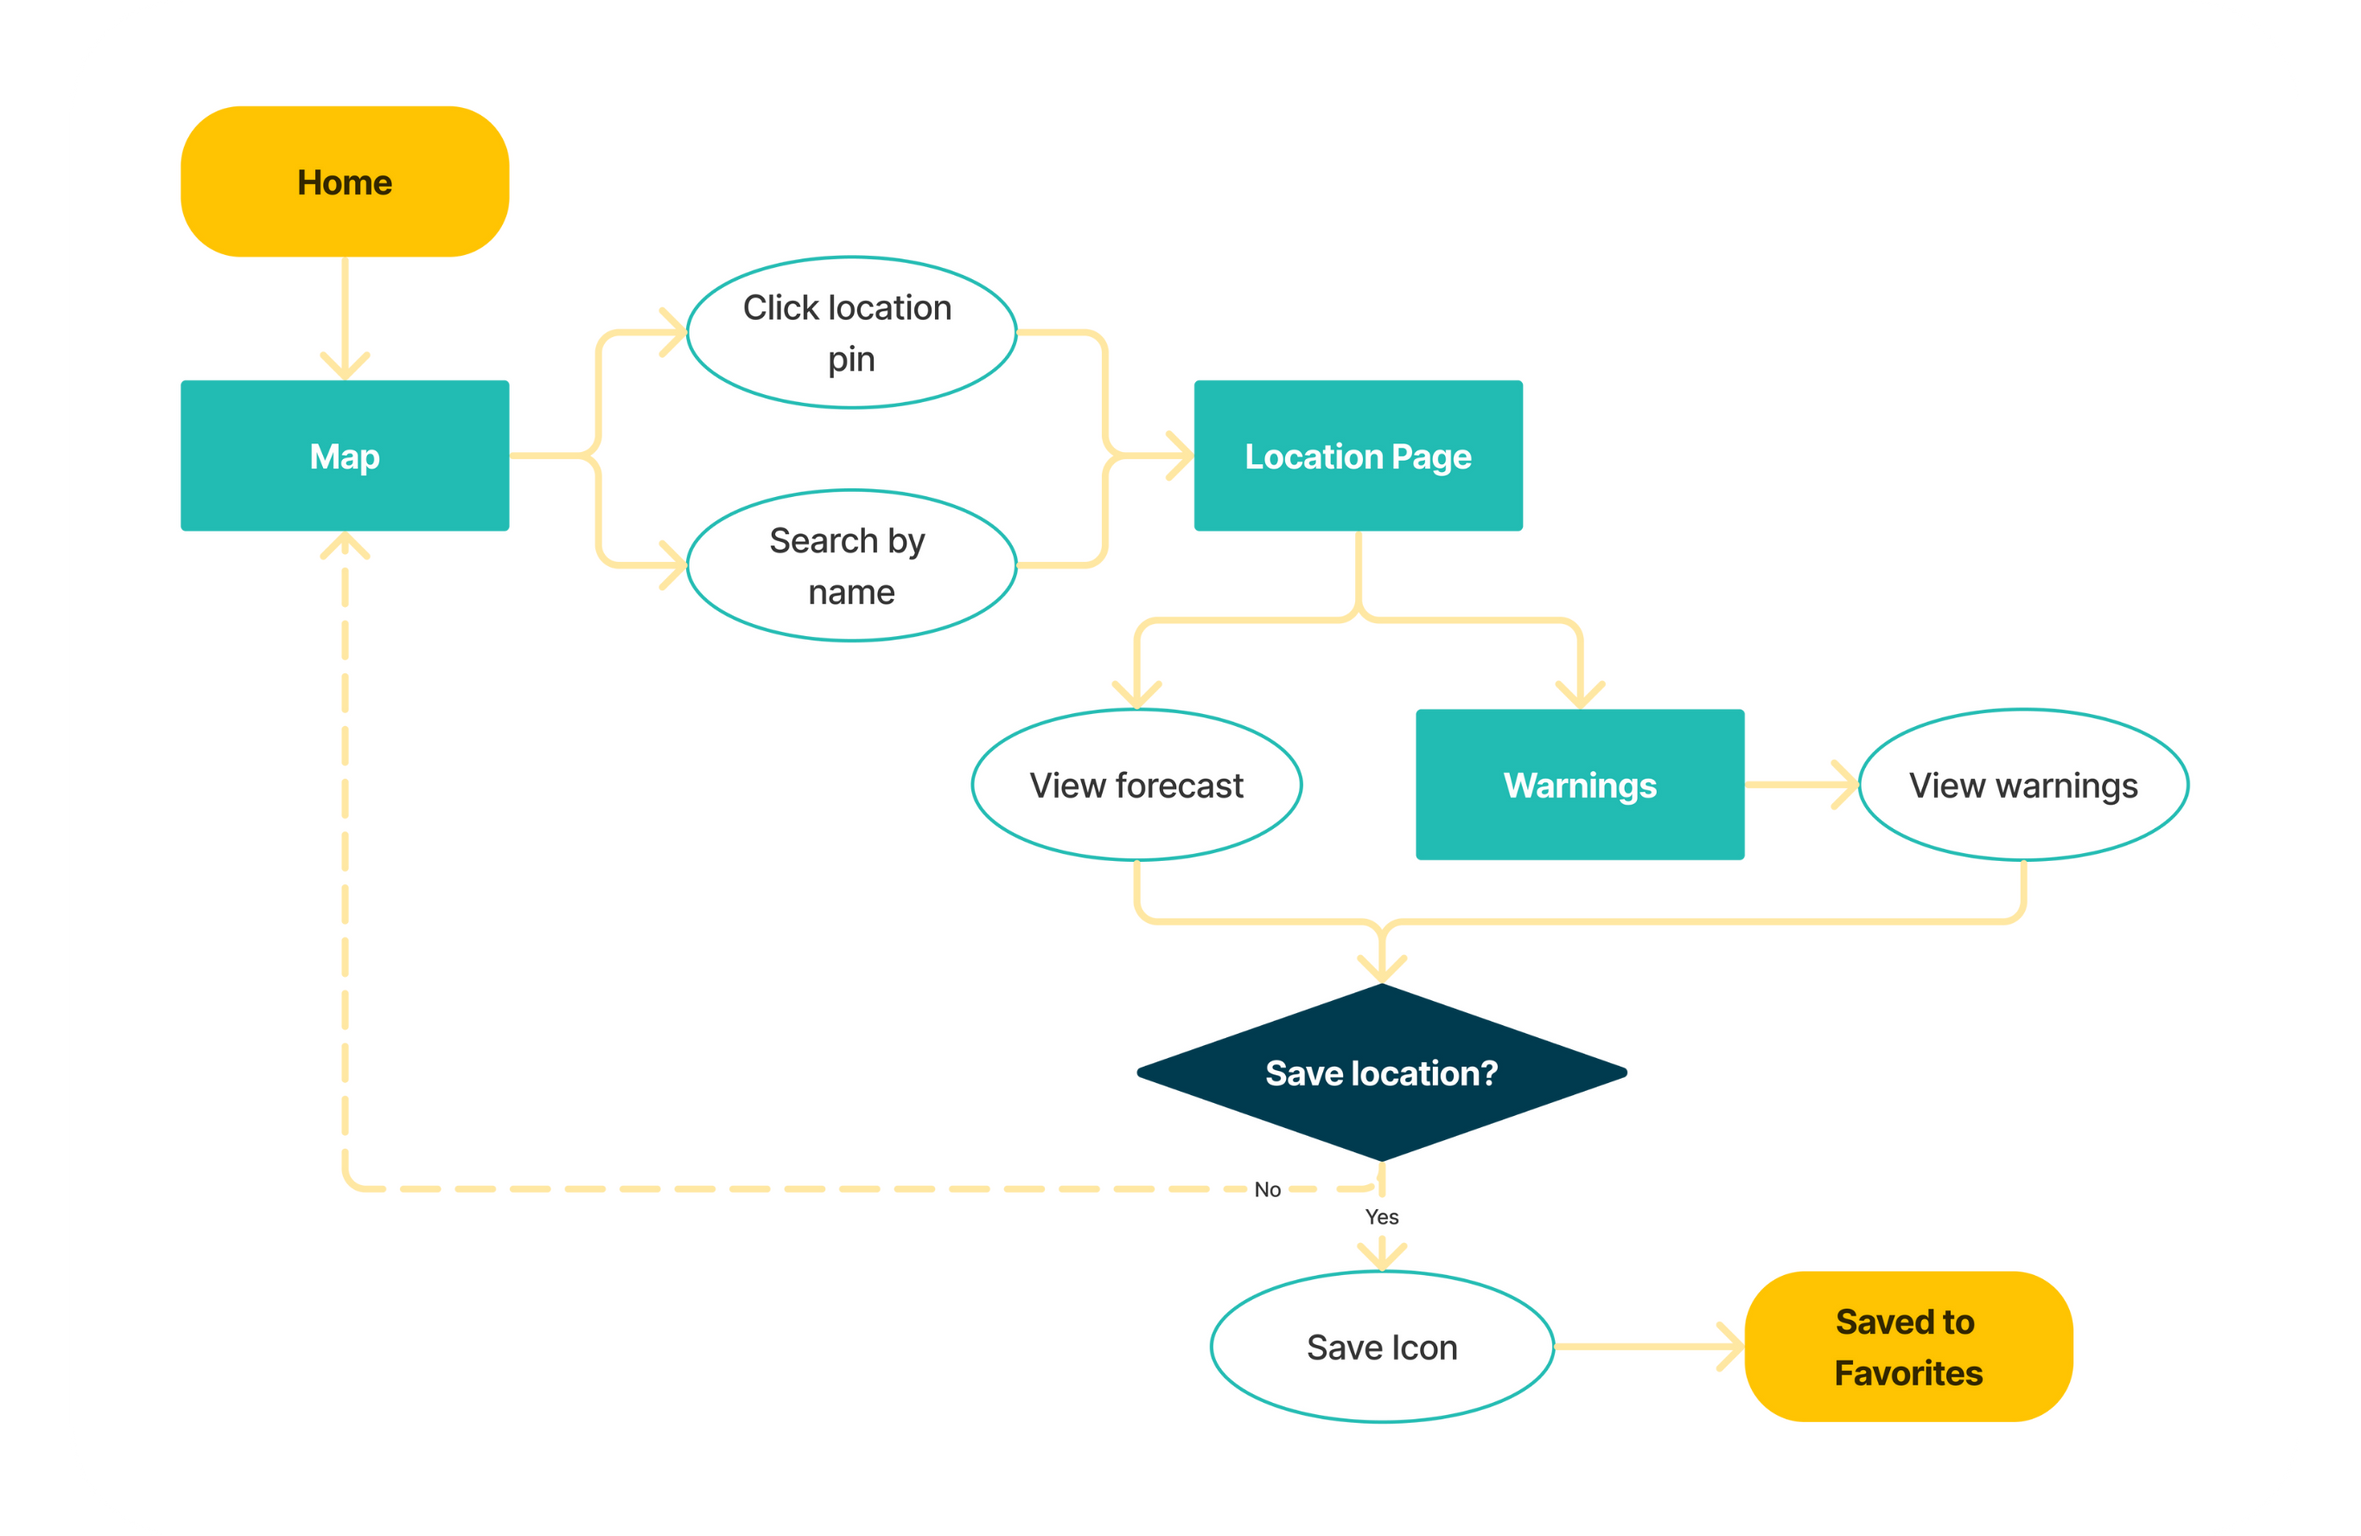
Once I'd gained a better understanding of my users and goals through research, I created user personas and identified user journeys. With that information, I started building my user flows around the major tasks users would complete on my app.
User Personas
View and save a location's weather forecast:
Wireframes ↑
It was time to start taking all my research and finding a way to integrate it all into a design that would be straightforward, easy to use, and provide as many solutions to its user as possible.
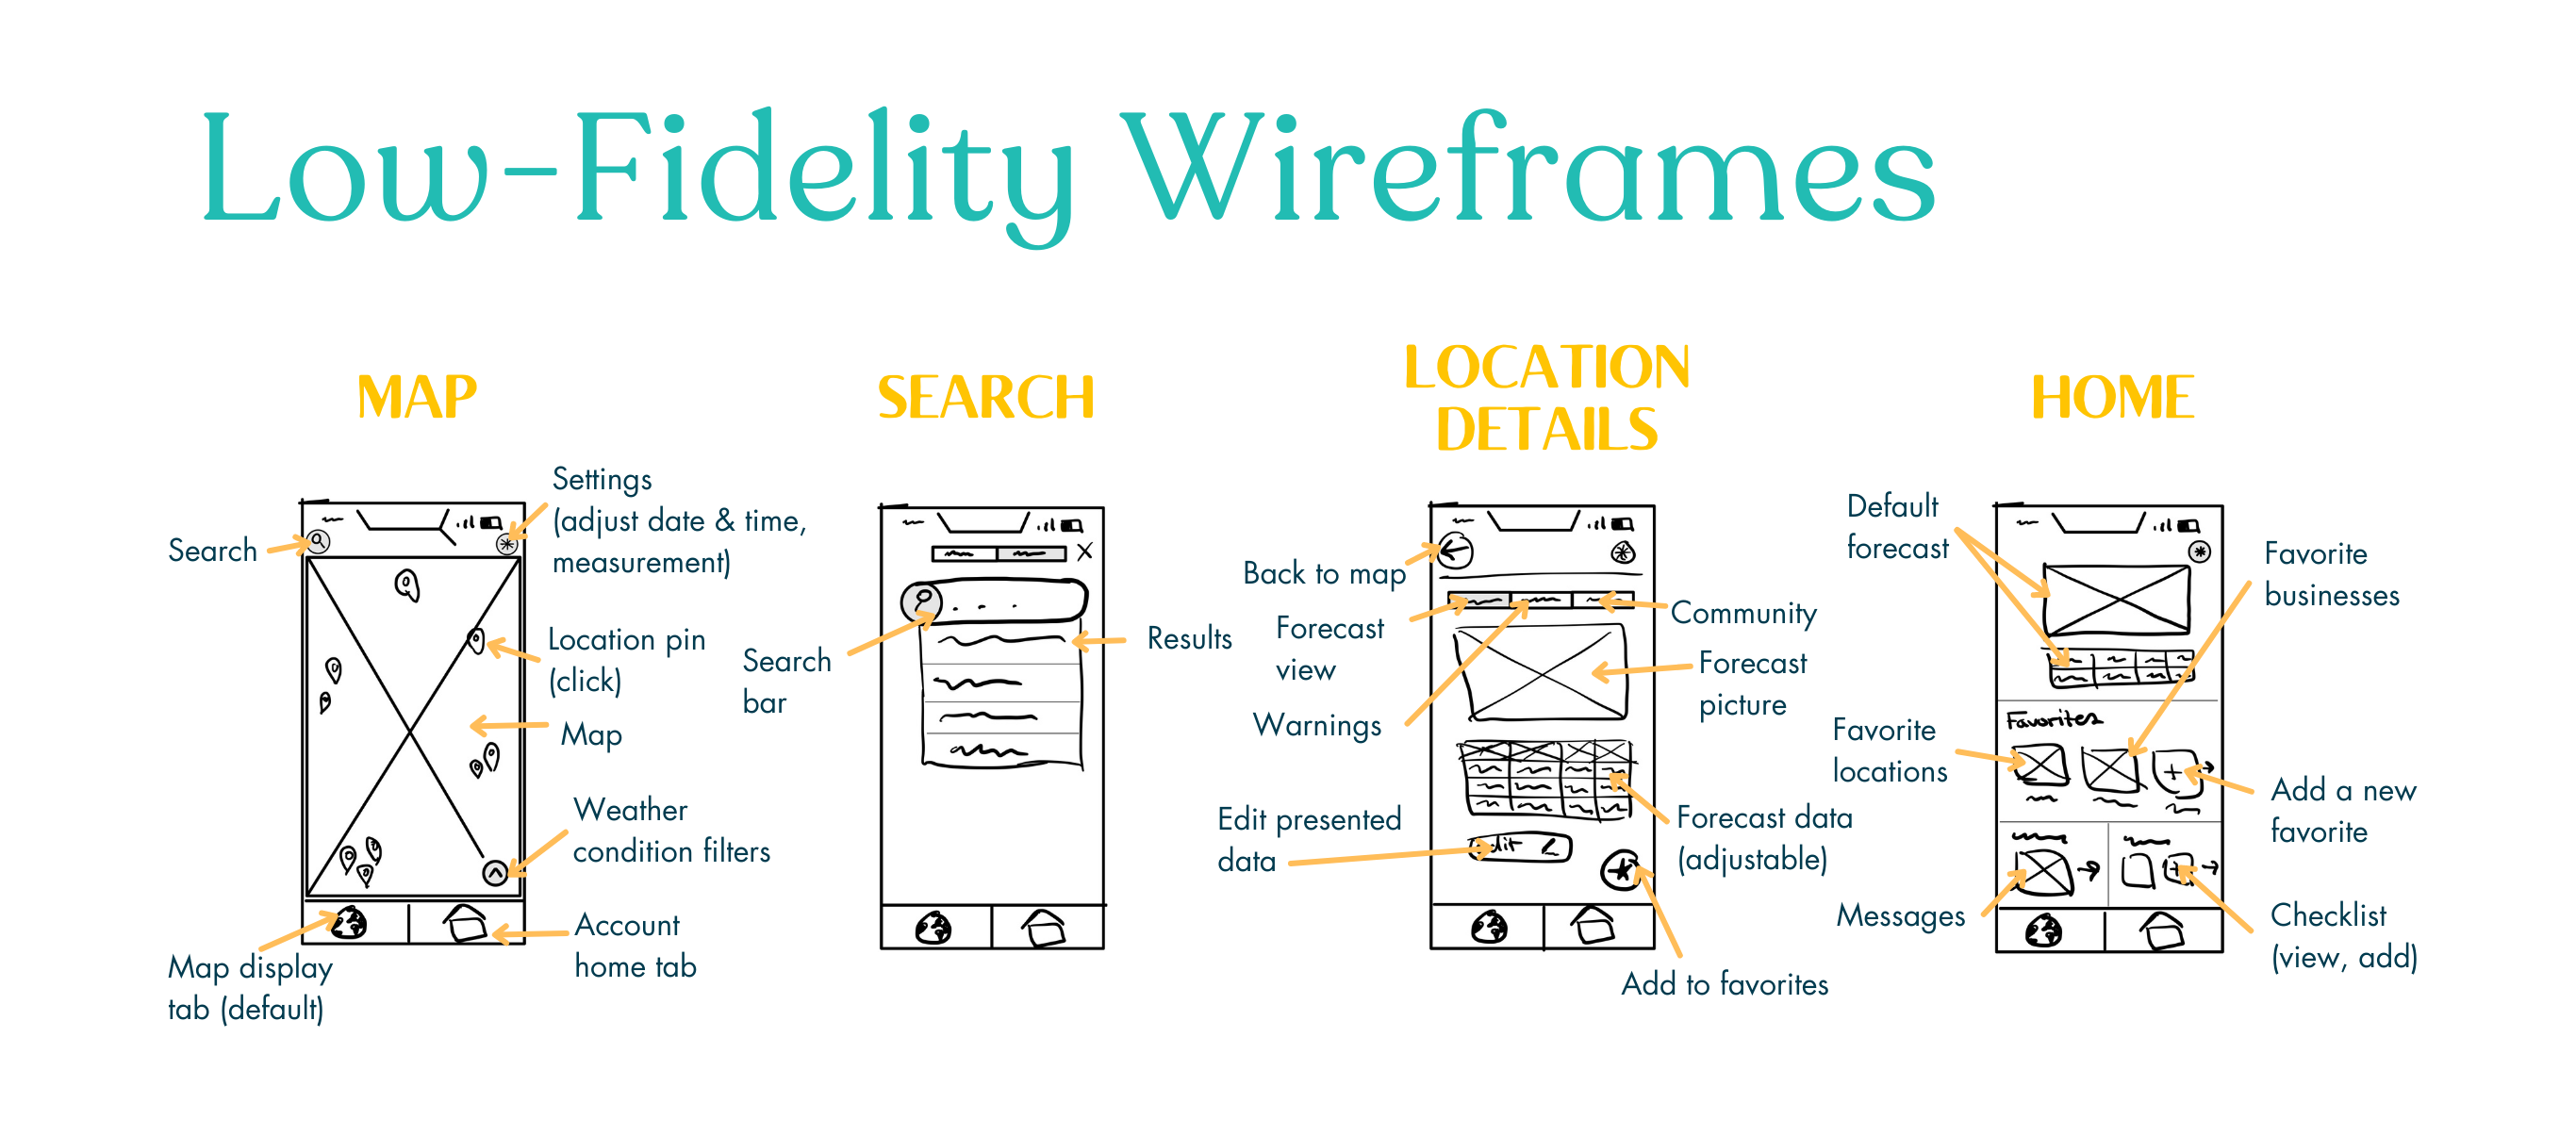
Starting off with low-fidelity wireframes, I started to visualize the skeleton of my project. I focused primarily on basic functionality, where I began to address the primary user flows and how they would look within the app itself. I then started moving towards recreating those low-fidelity wireframes with Sketch, so I could have a cleaner visualization as I moved forward into prototyping and mid-fidelity wireframes.
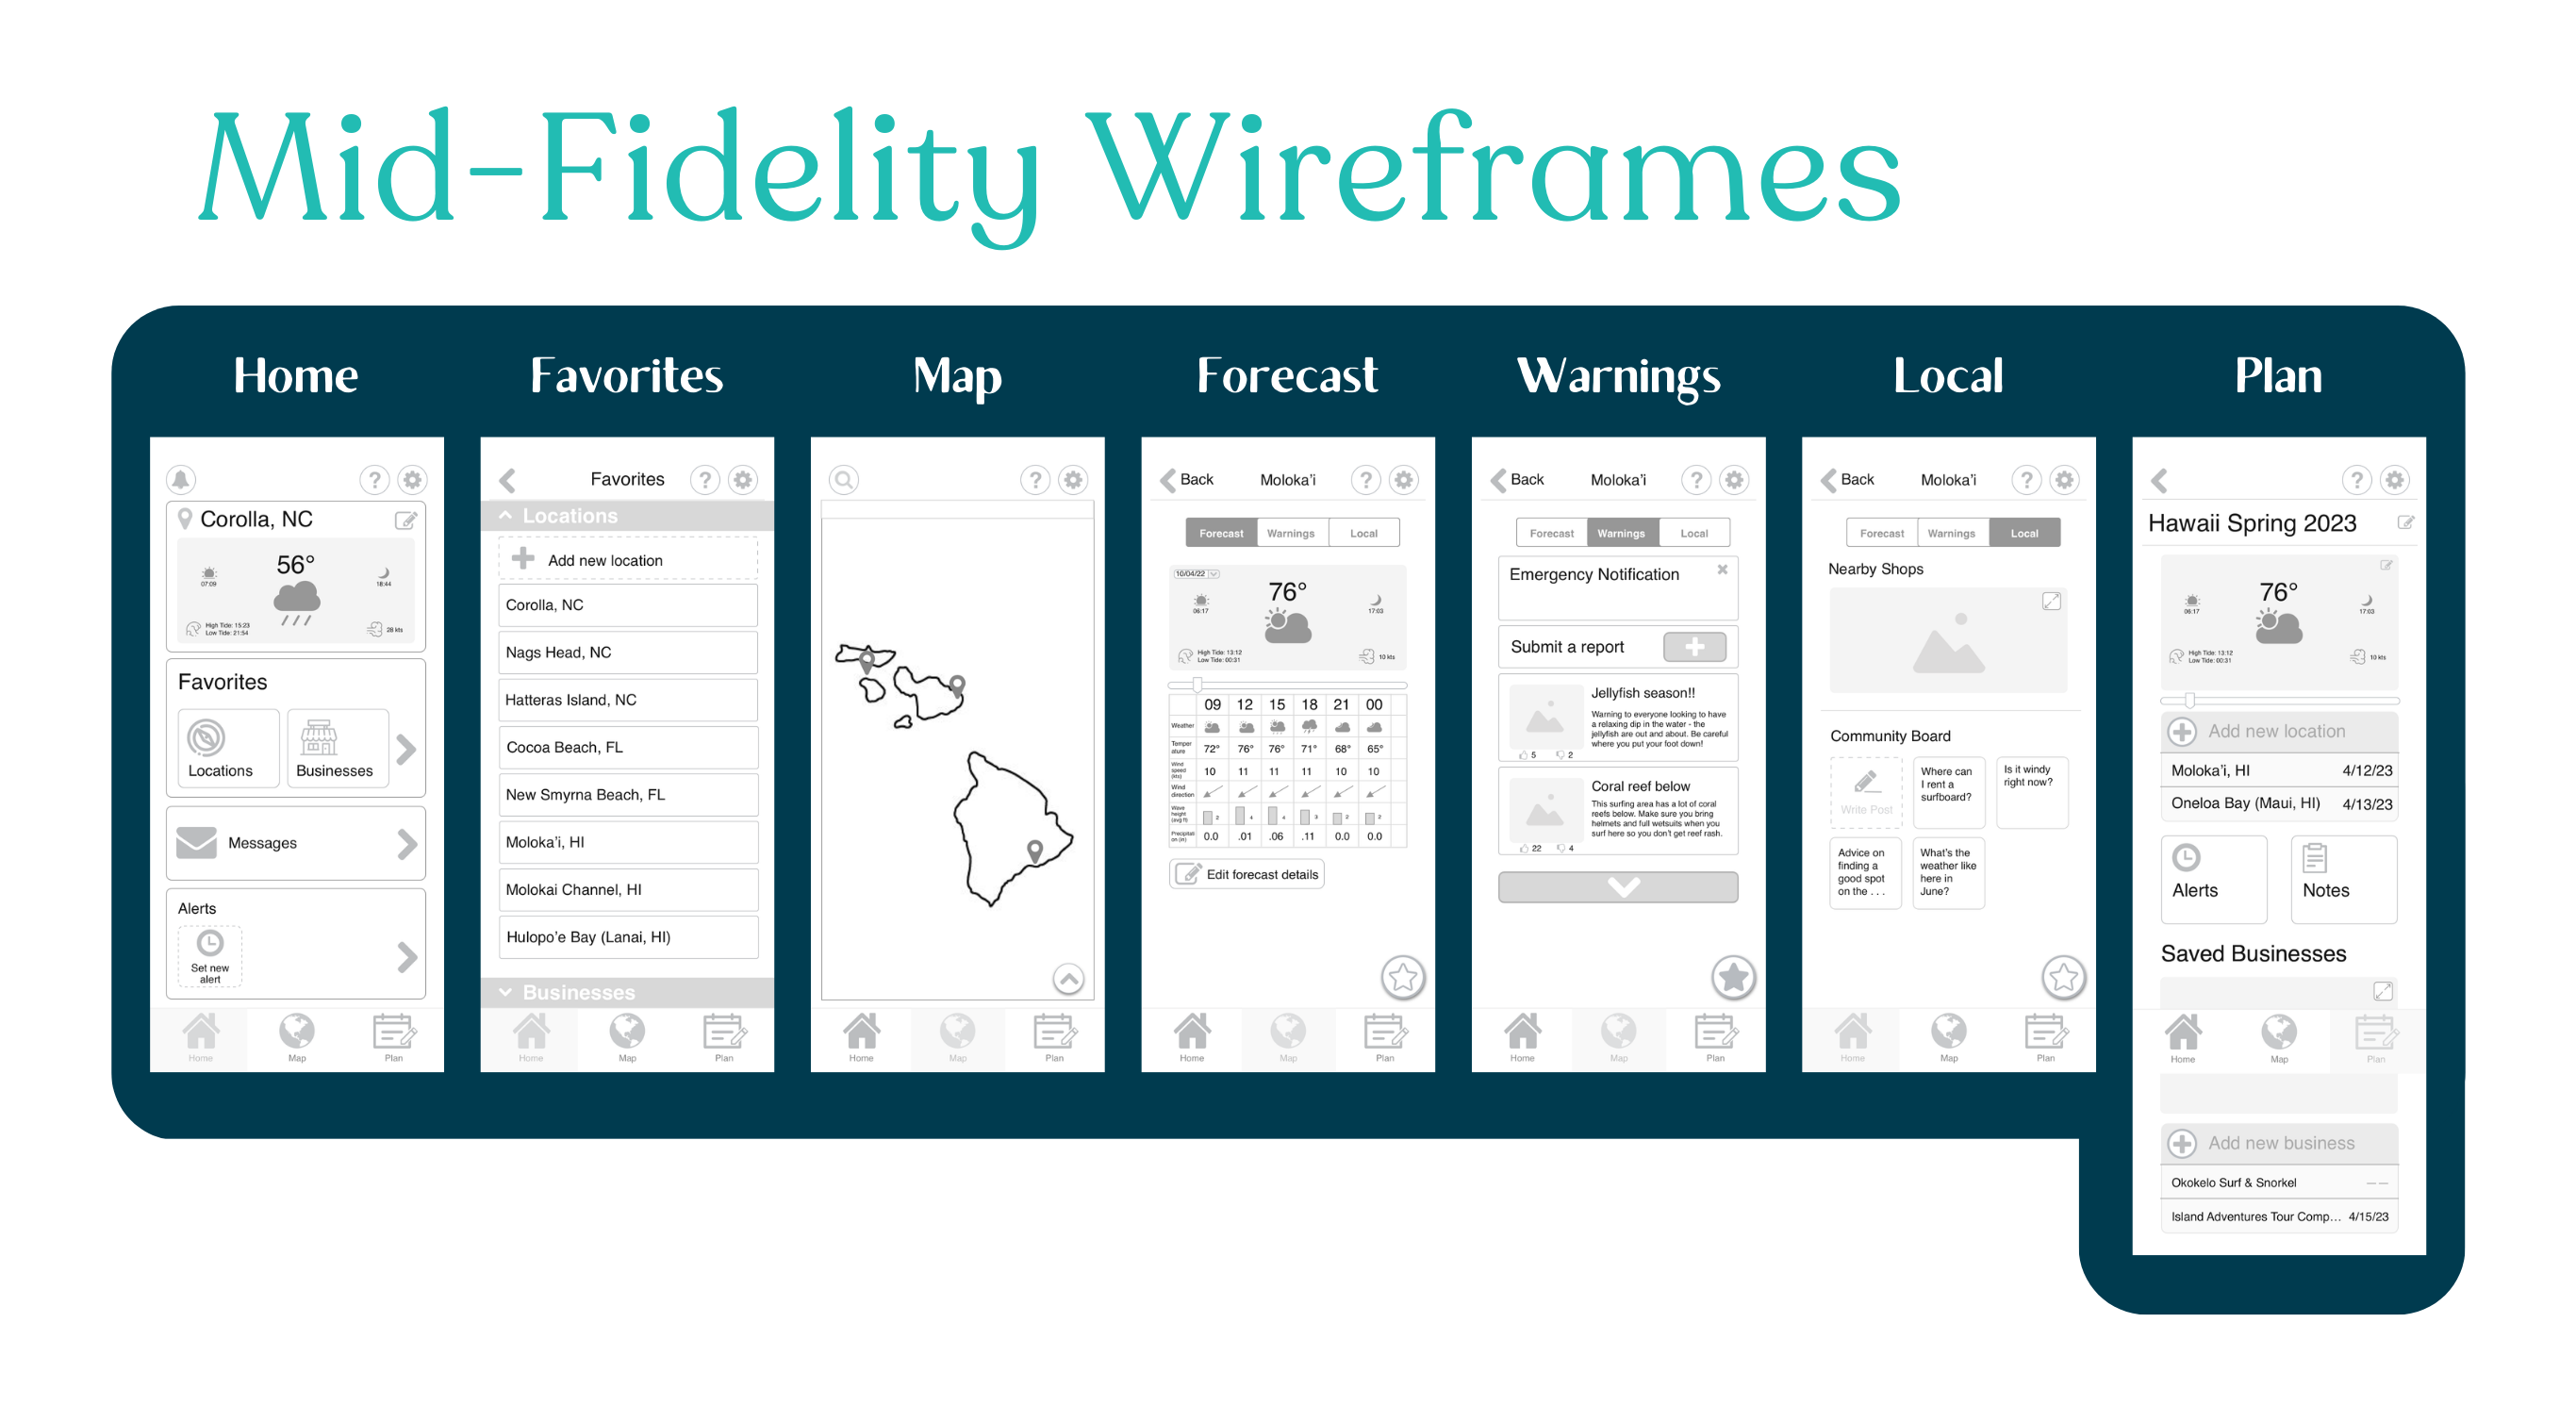
Once I had a rough idea of the features and placement for my screens, I headed back to Sketch to start developing my mid-fidelity wireframes, where I started developing what the visual representation of weather data would look like, as well as a functional early prototype.
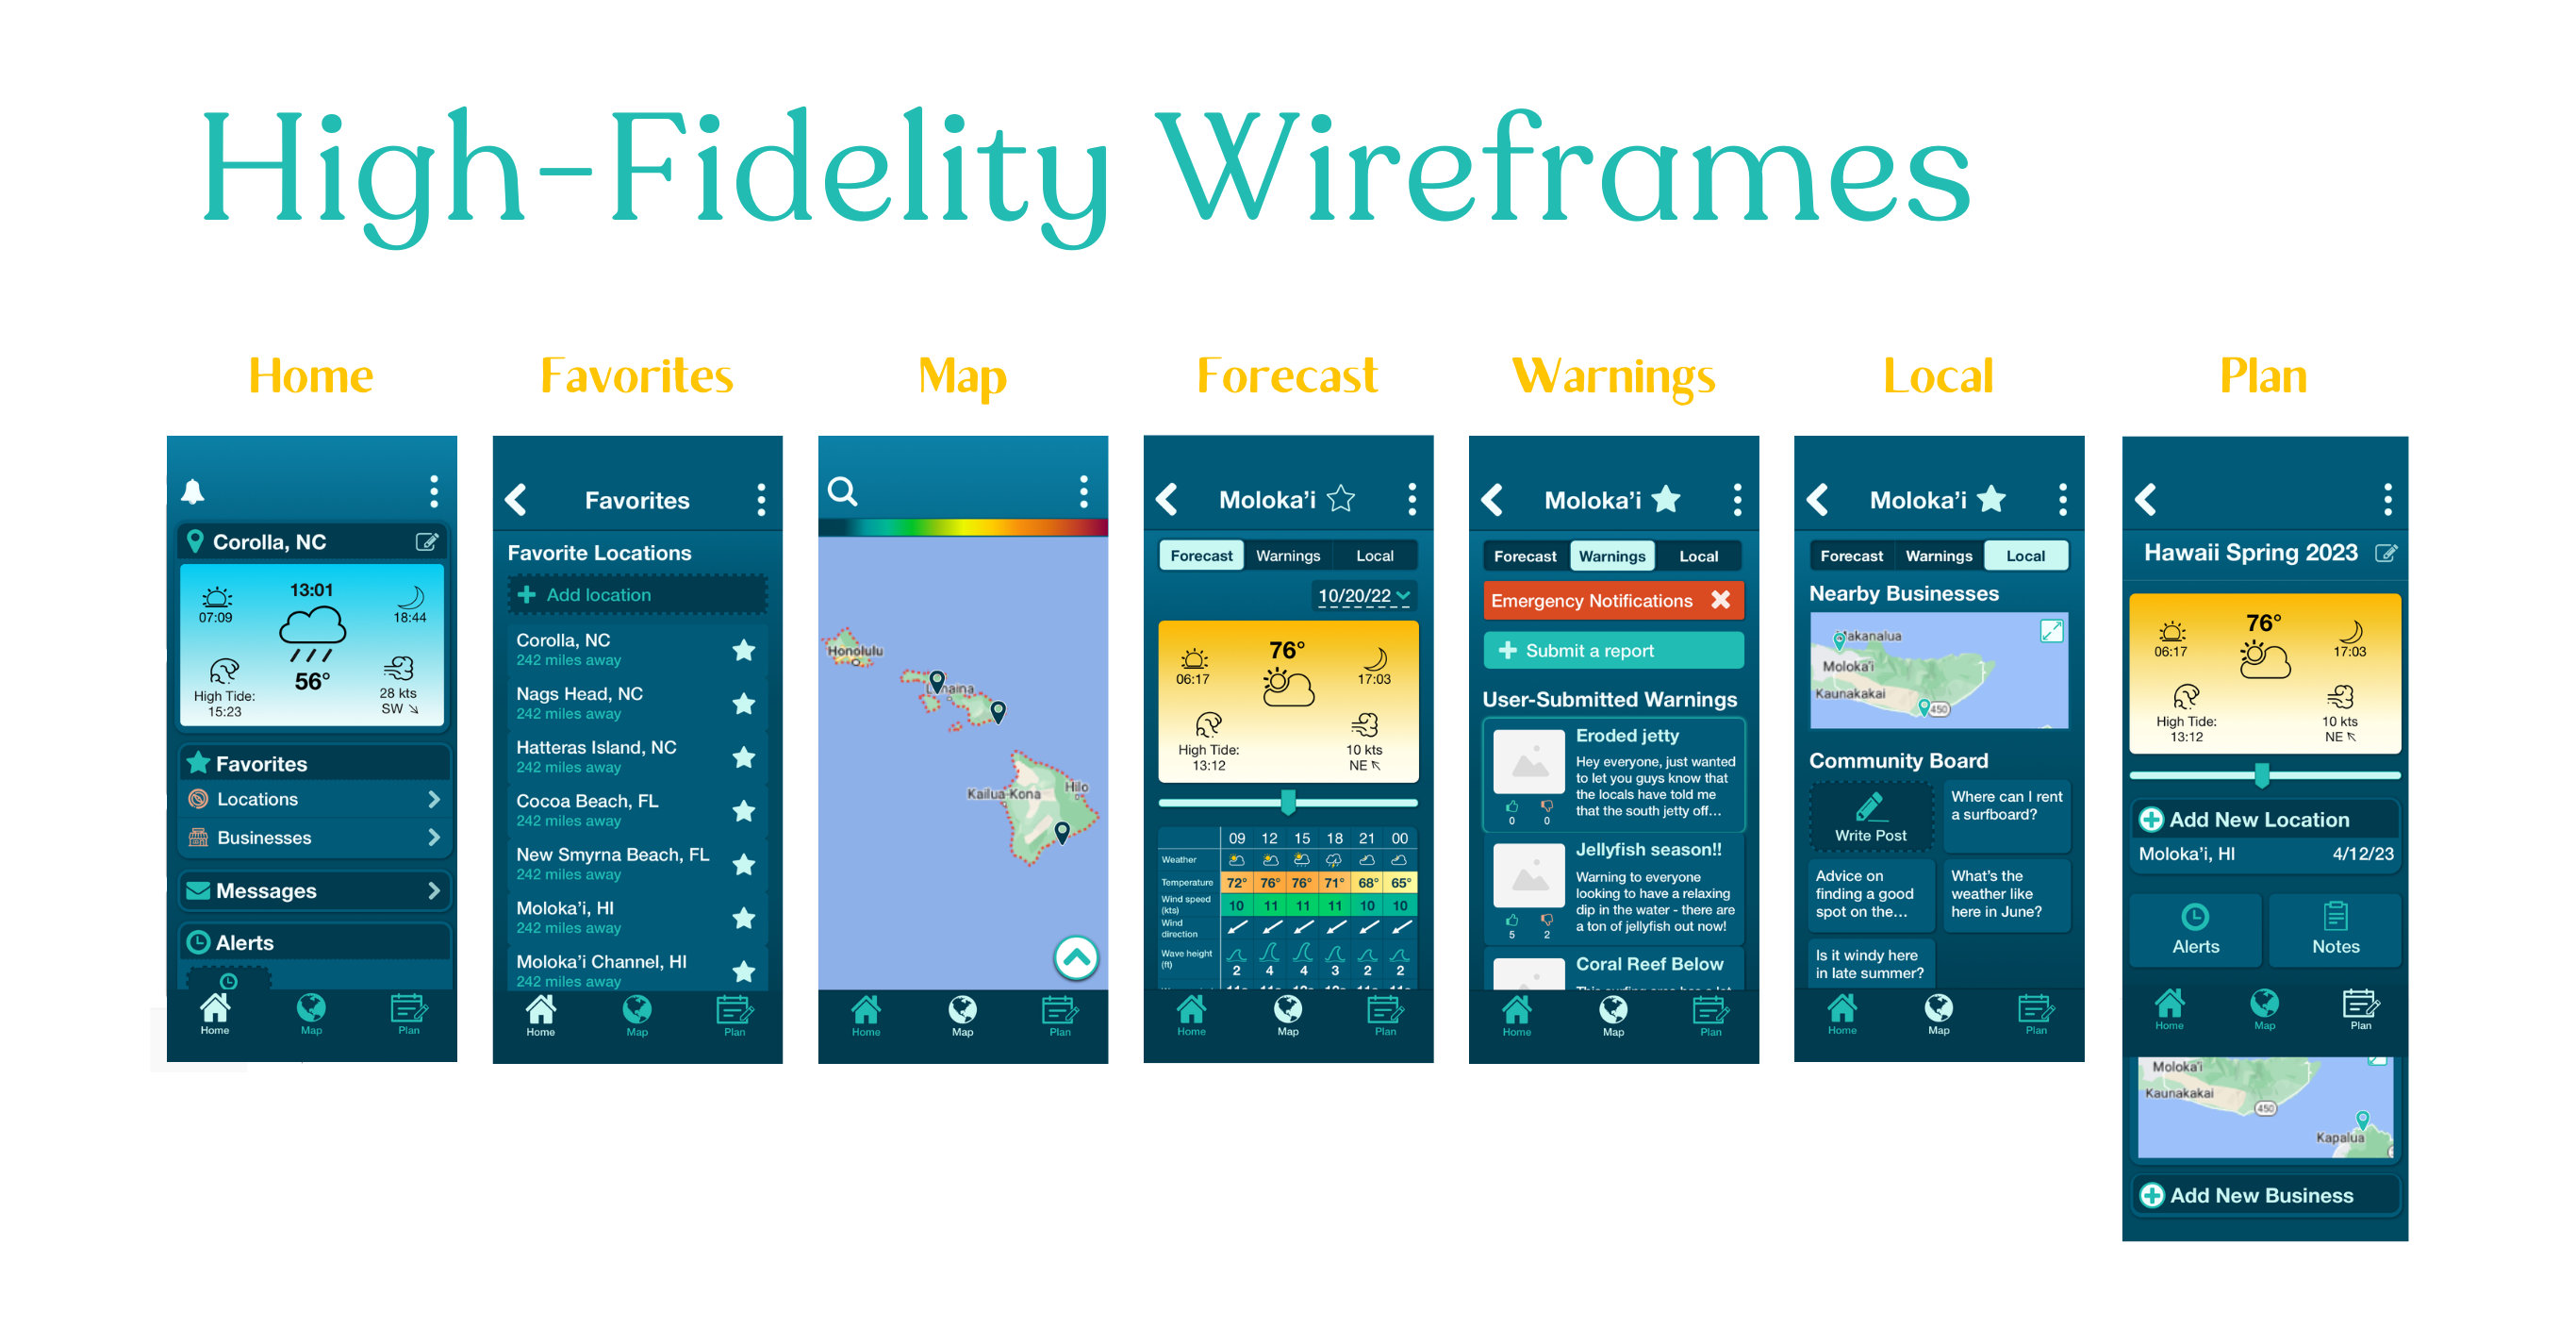
Afterwards, I moved on to creating my high-fidelity wireframes. I focused on giving it more attractive UI, and used the high-fidelity prototype to test my both my UX and UI during user testing.
User Testing ↑
Test Goals
Assess learnability and usability of the Vela app.
Evaluate users' satisfaction with information and features provided.
Observe how users navigate the app and find their way to the details of a location.
Observe how easily users find and create a vacation plan.
Test Objectives
Finding a location and viewing the conditions of a location (forecast and warnings).
Contacting a company or store nearby a location.
Creating a vacation plan with multiple locations.
Methodology
6 participants
Remote & in-person moderated testing
10-20 minute test sessions
Recorded sessions
Users are given a short briefing, then asked to think aloud as they proceed to complete tasks using the Vela app. They then complete a short survey and are debriefed.
Key Changes
Location pins were made larger, given an outline, and had a drop shadow added to them so they stood out against the map.
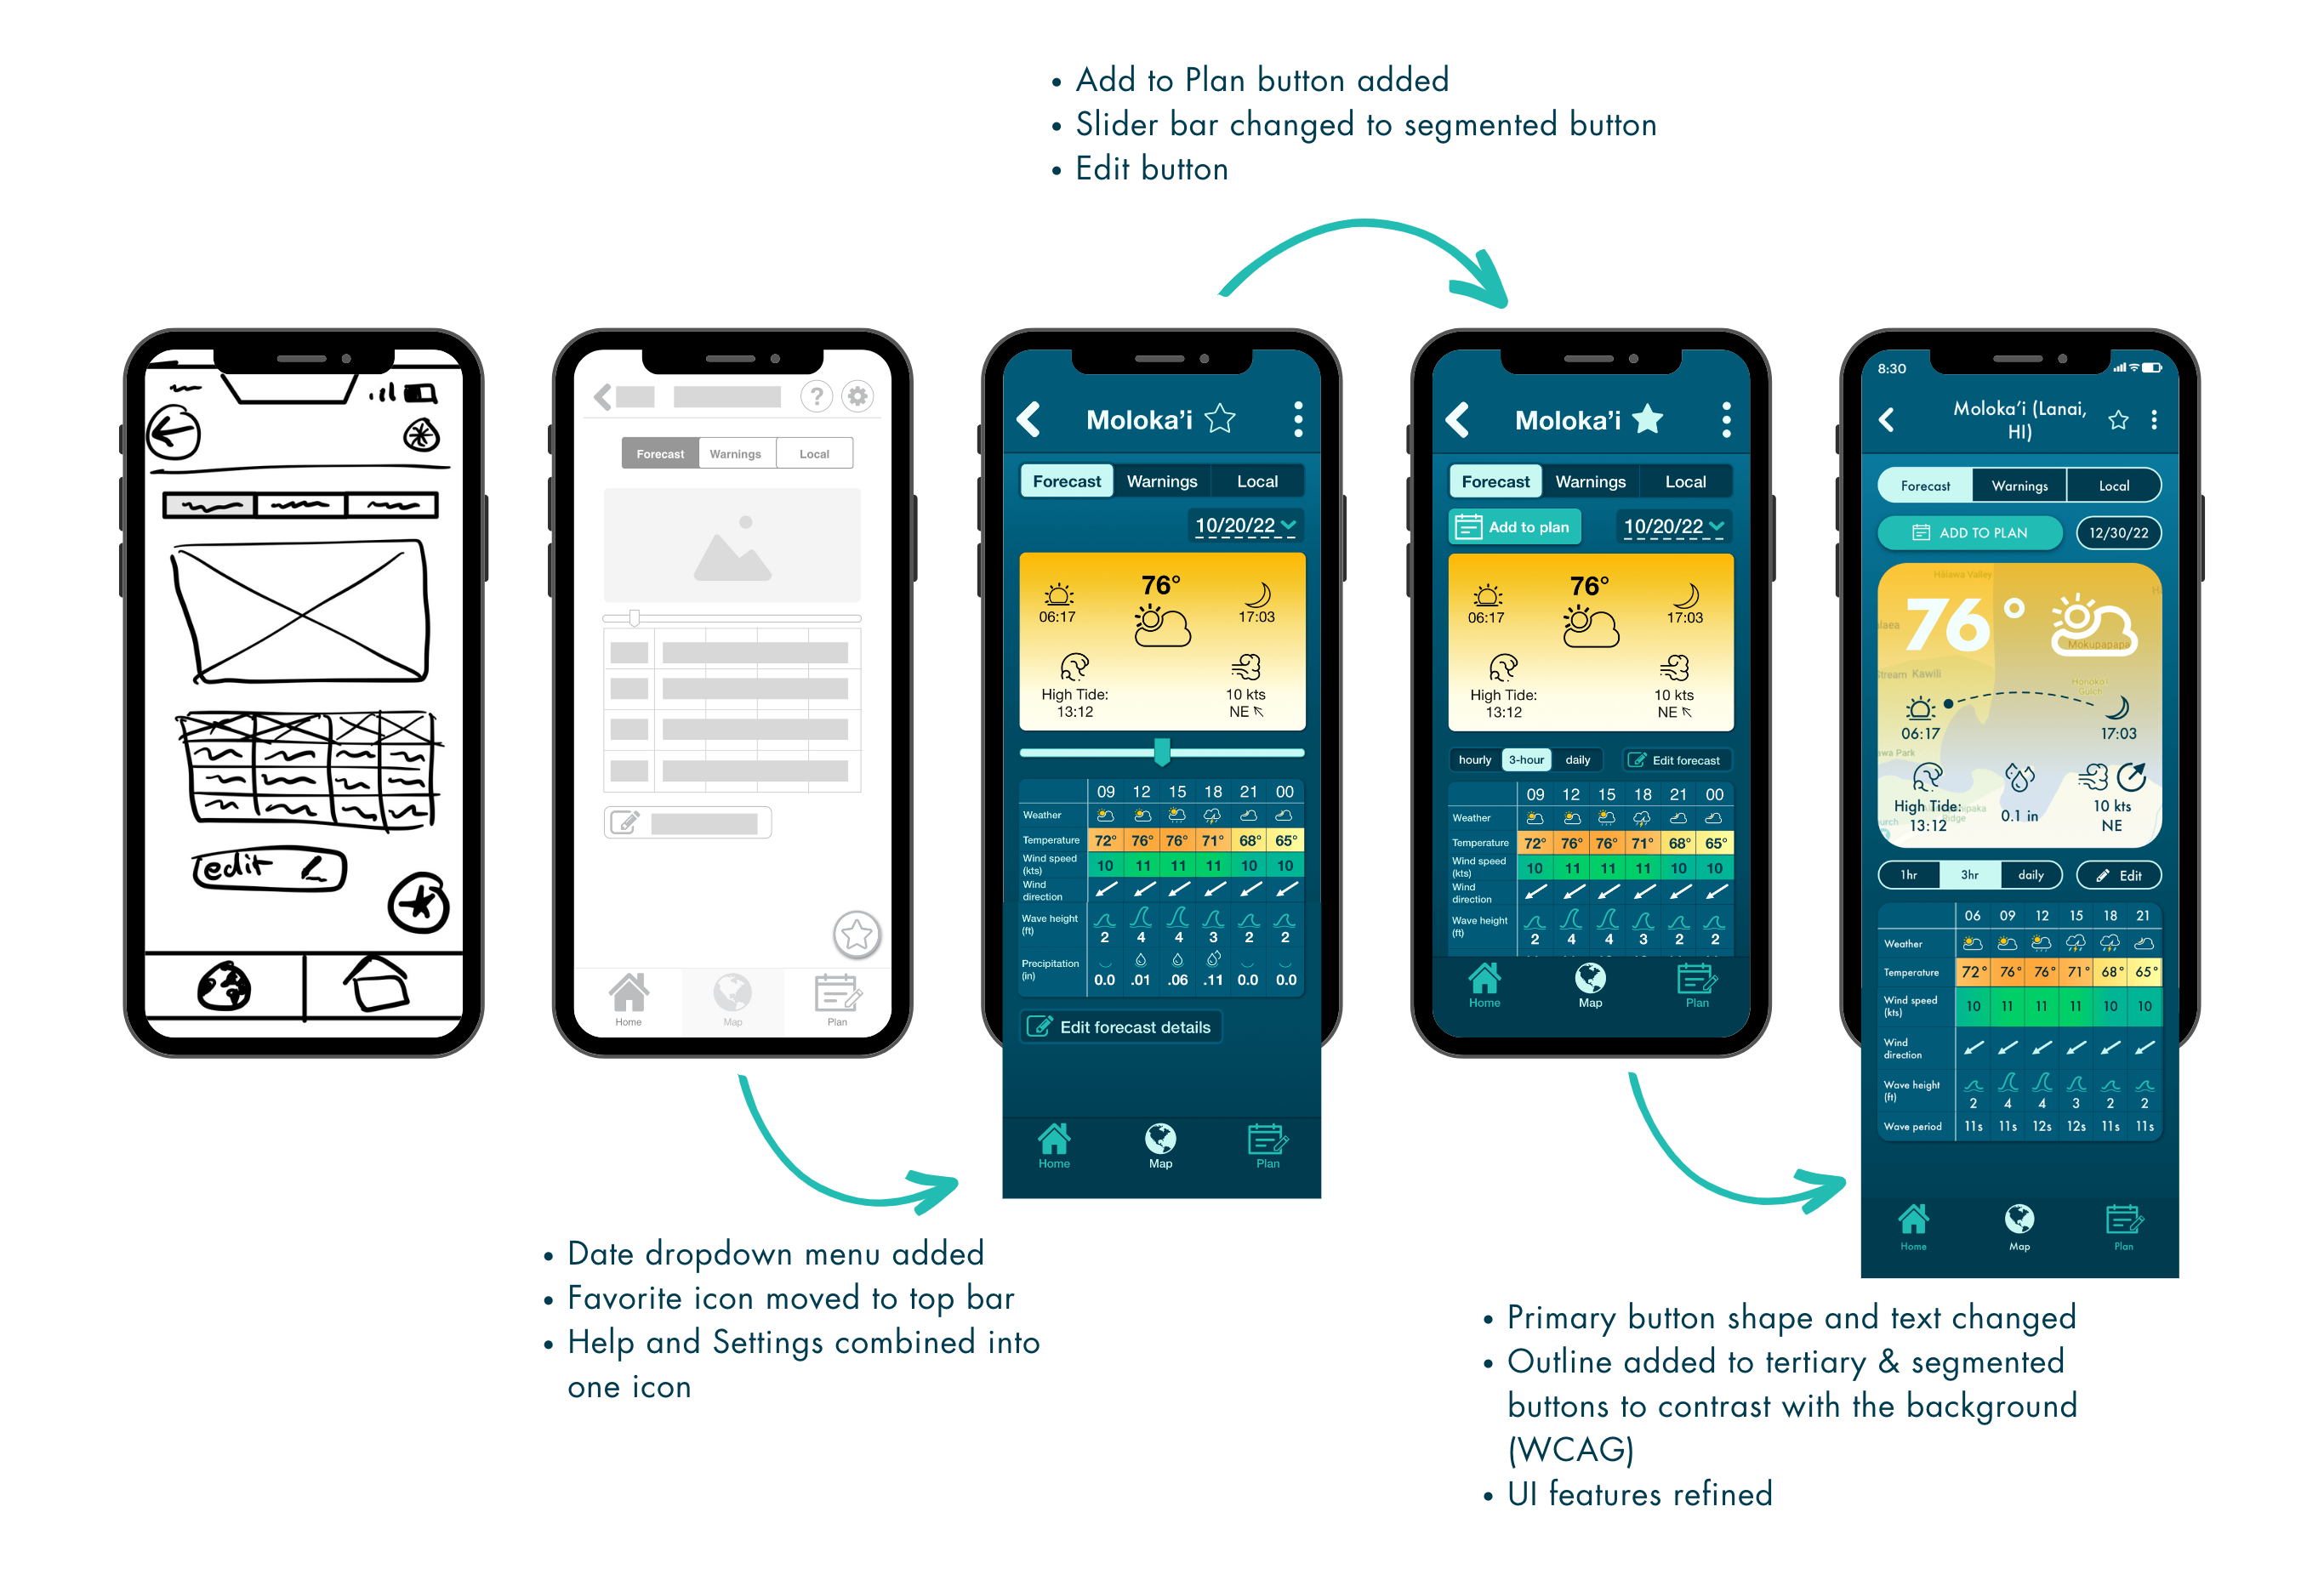
A primary CTA, “Add to Plan,” was added to the location page itself since it was the way most users initially tried to create a plan.
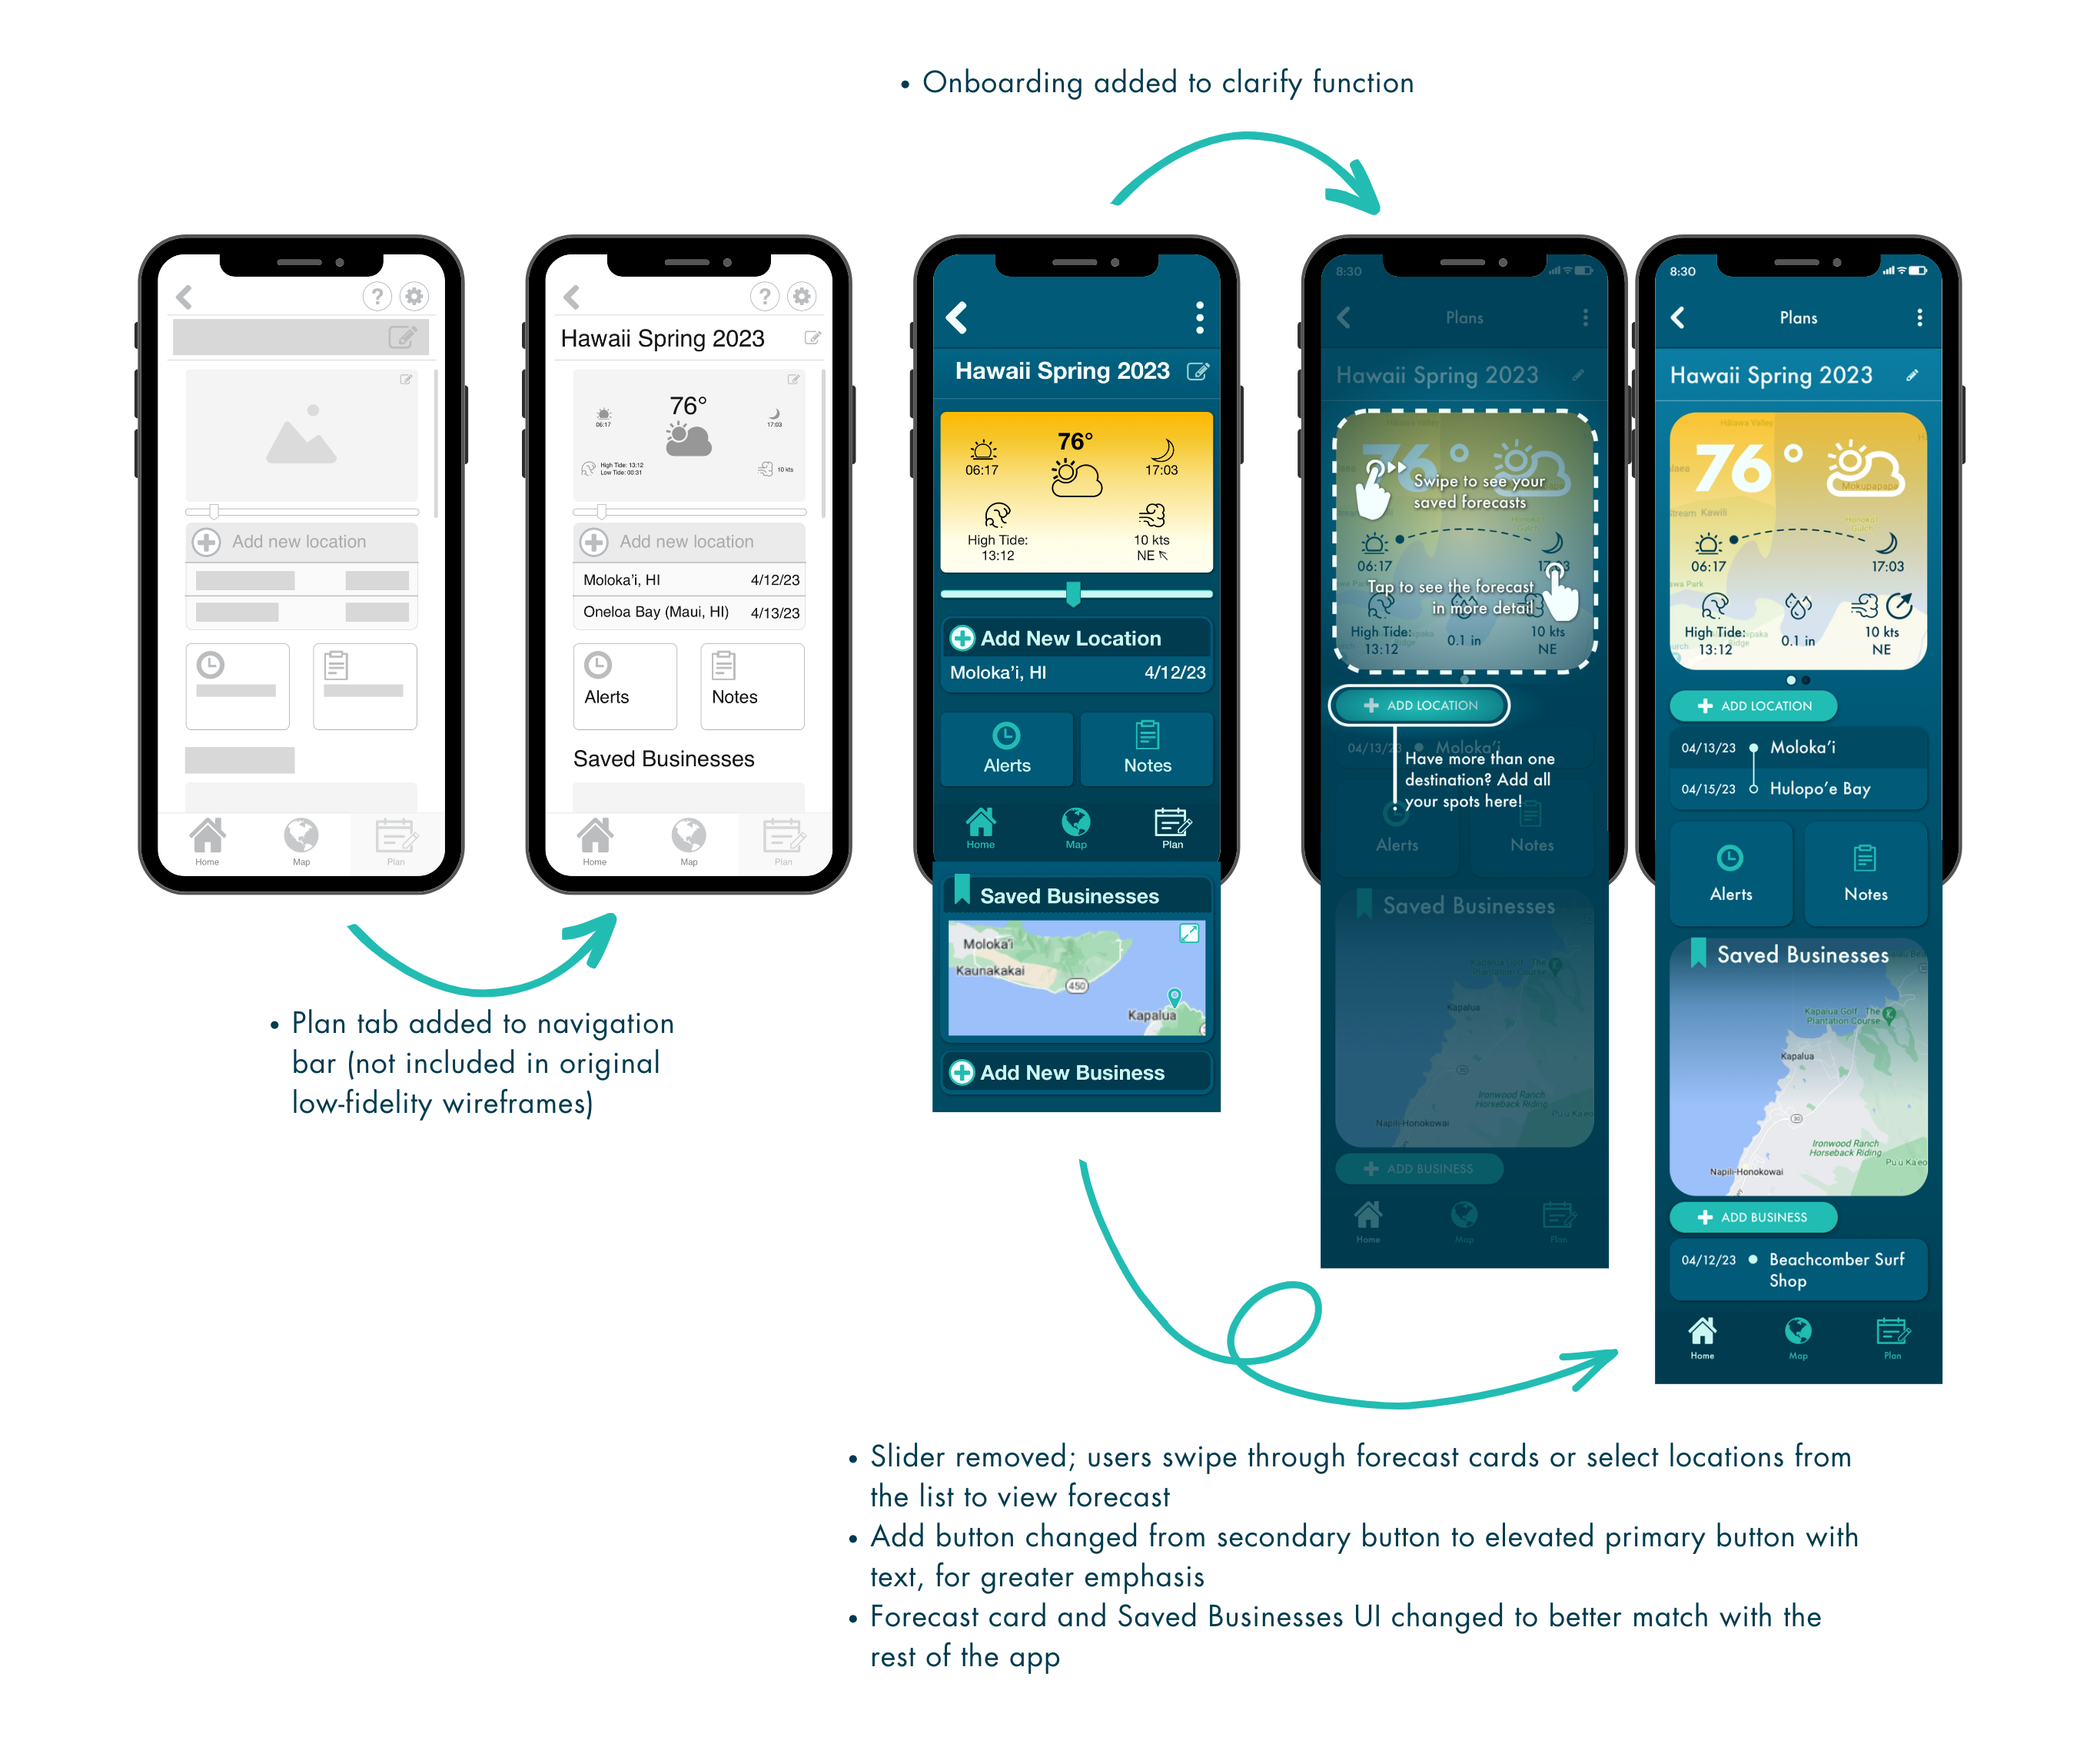
Coachmarks and progressive onboarding were implemented within the app itself to offset the initial learning curve and lessen the cognitive load during the initial onboarding.
The slider bar, used to adjust the timescale of the forecast, was replaced by a segmented button in order to more clearly communicate its purpose.
Design Iterations ↑
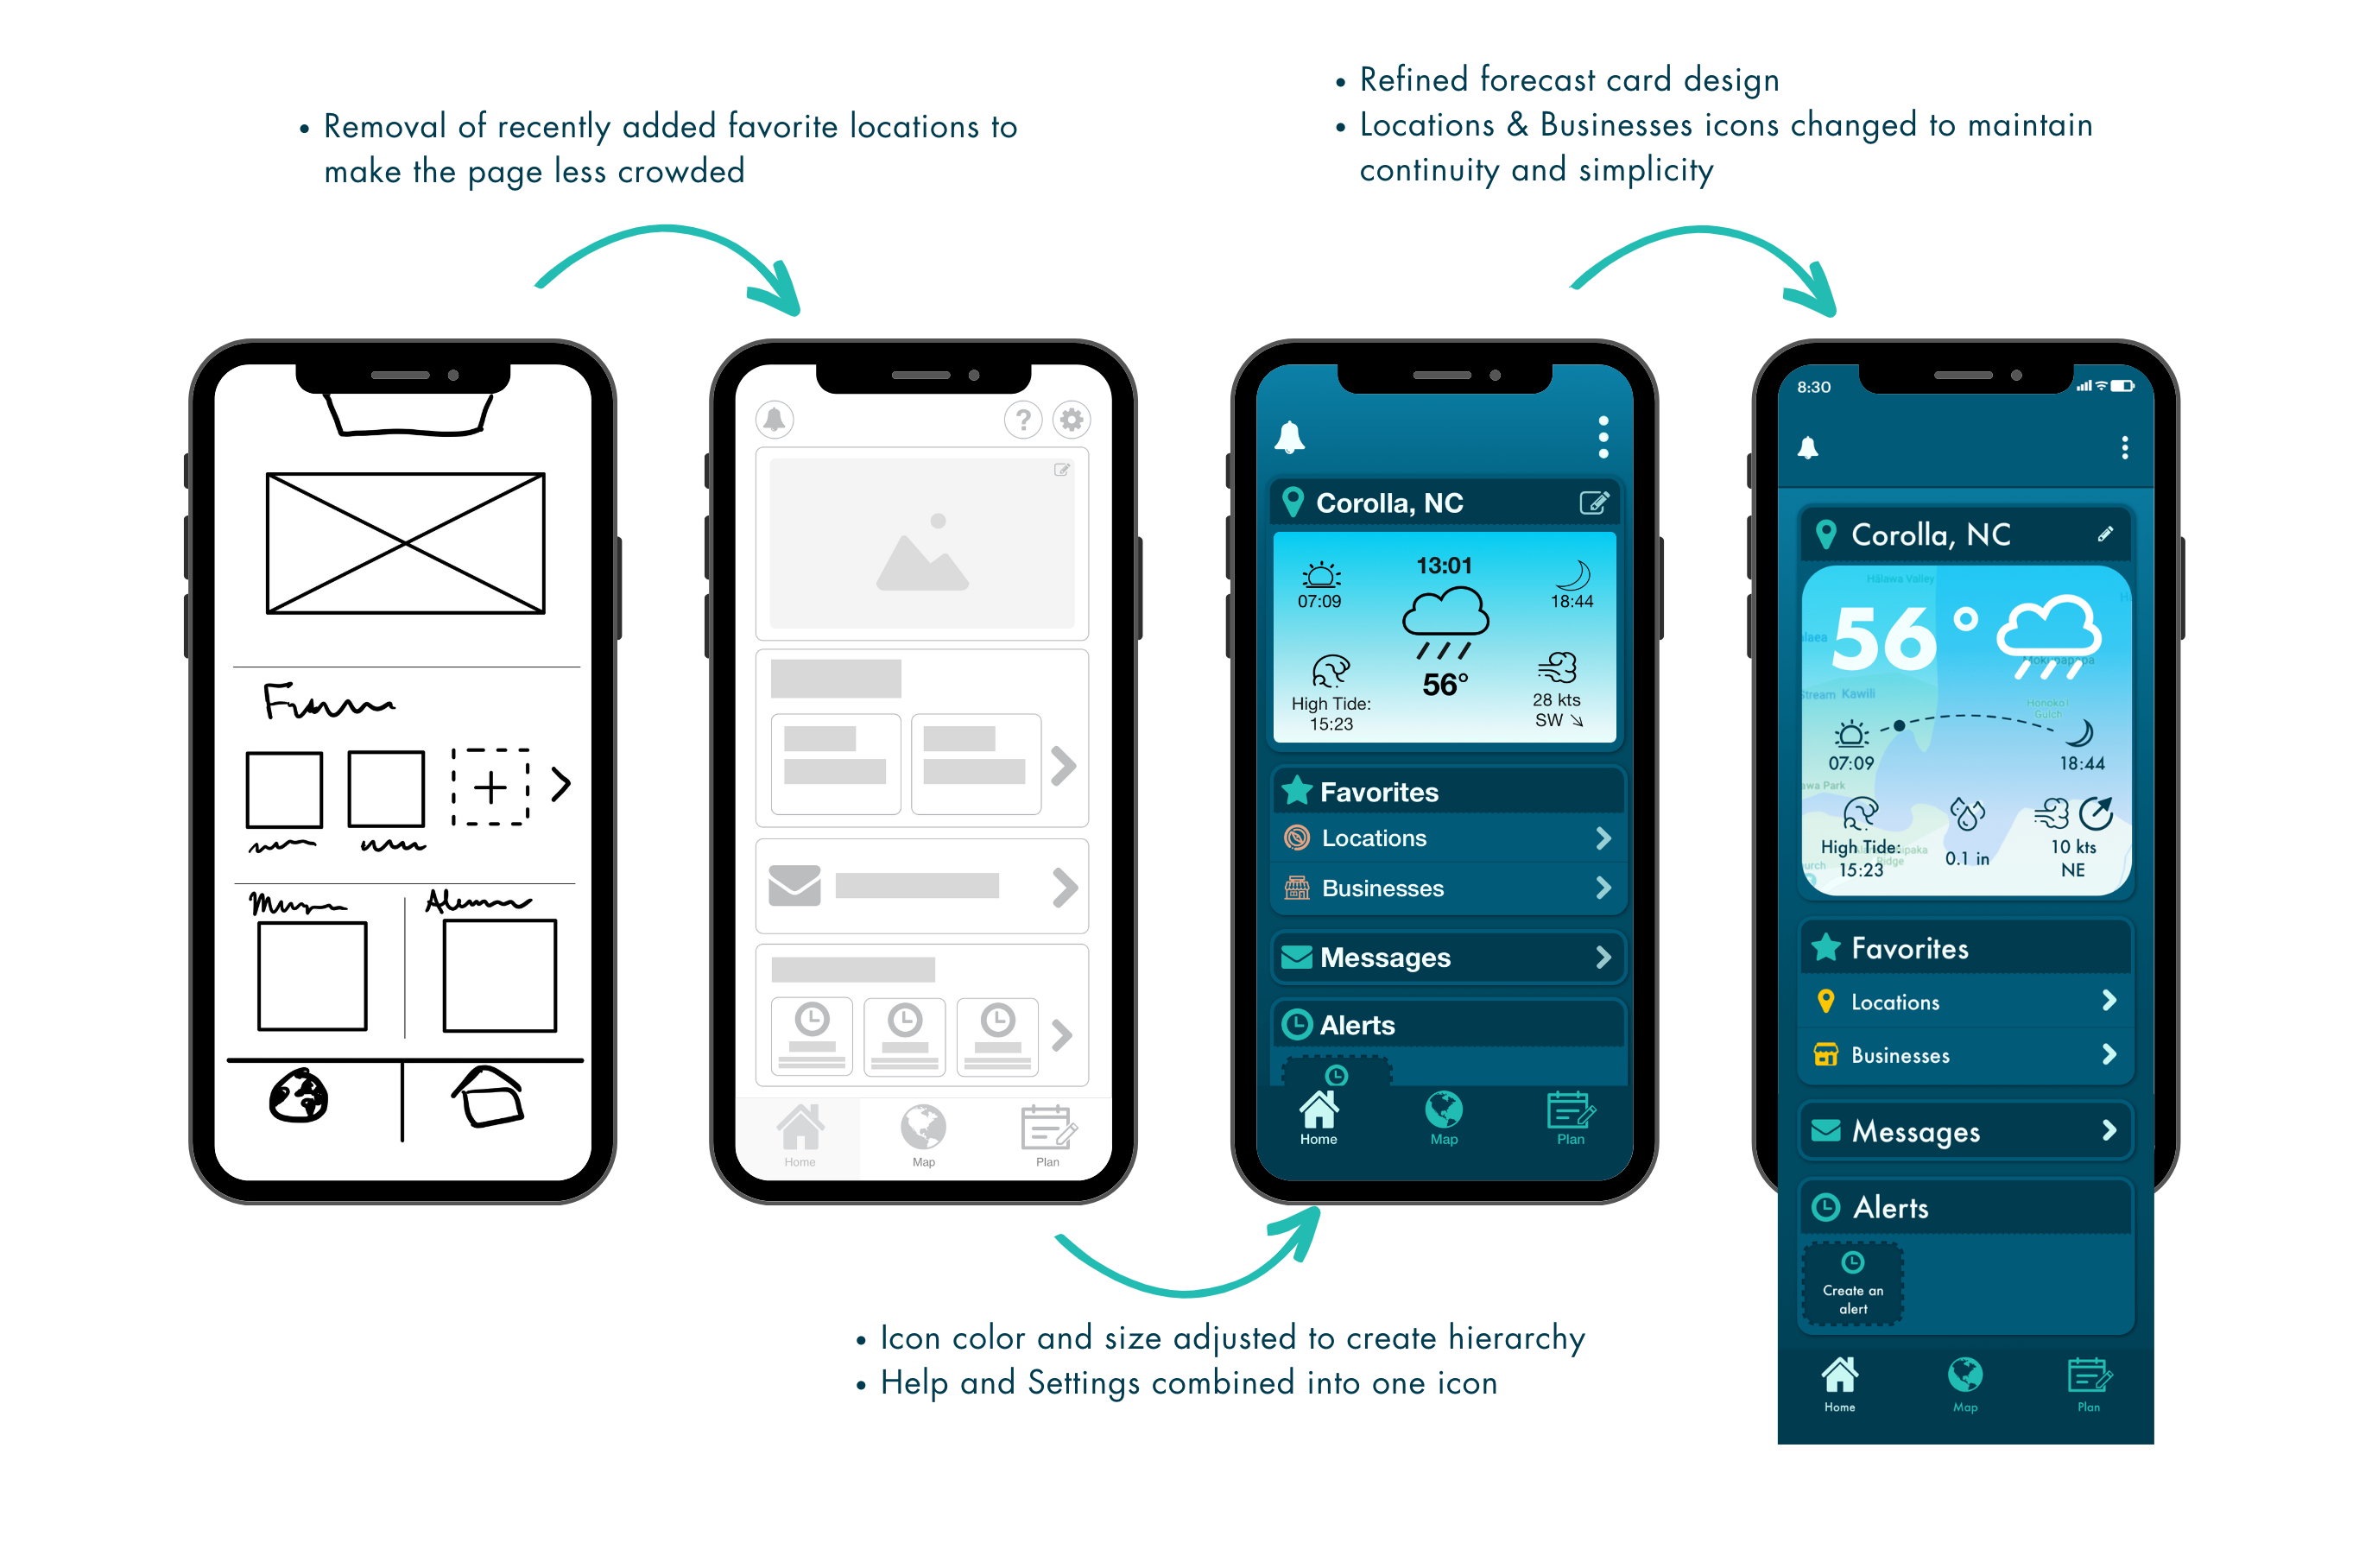
Home
The home page is a personal touchstone, where users can access their favorite locations and businesses, messages, and personally created weather condition alerts.
Location Details
The location page is one of the central features of the app, where users can view forecast information and access warnings and local businesses.
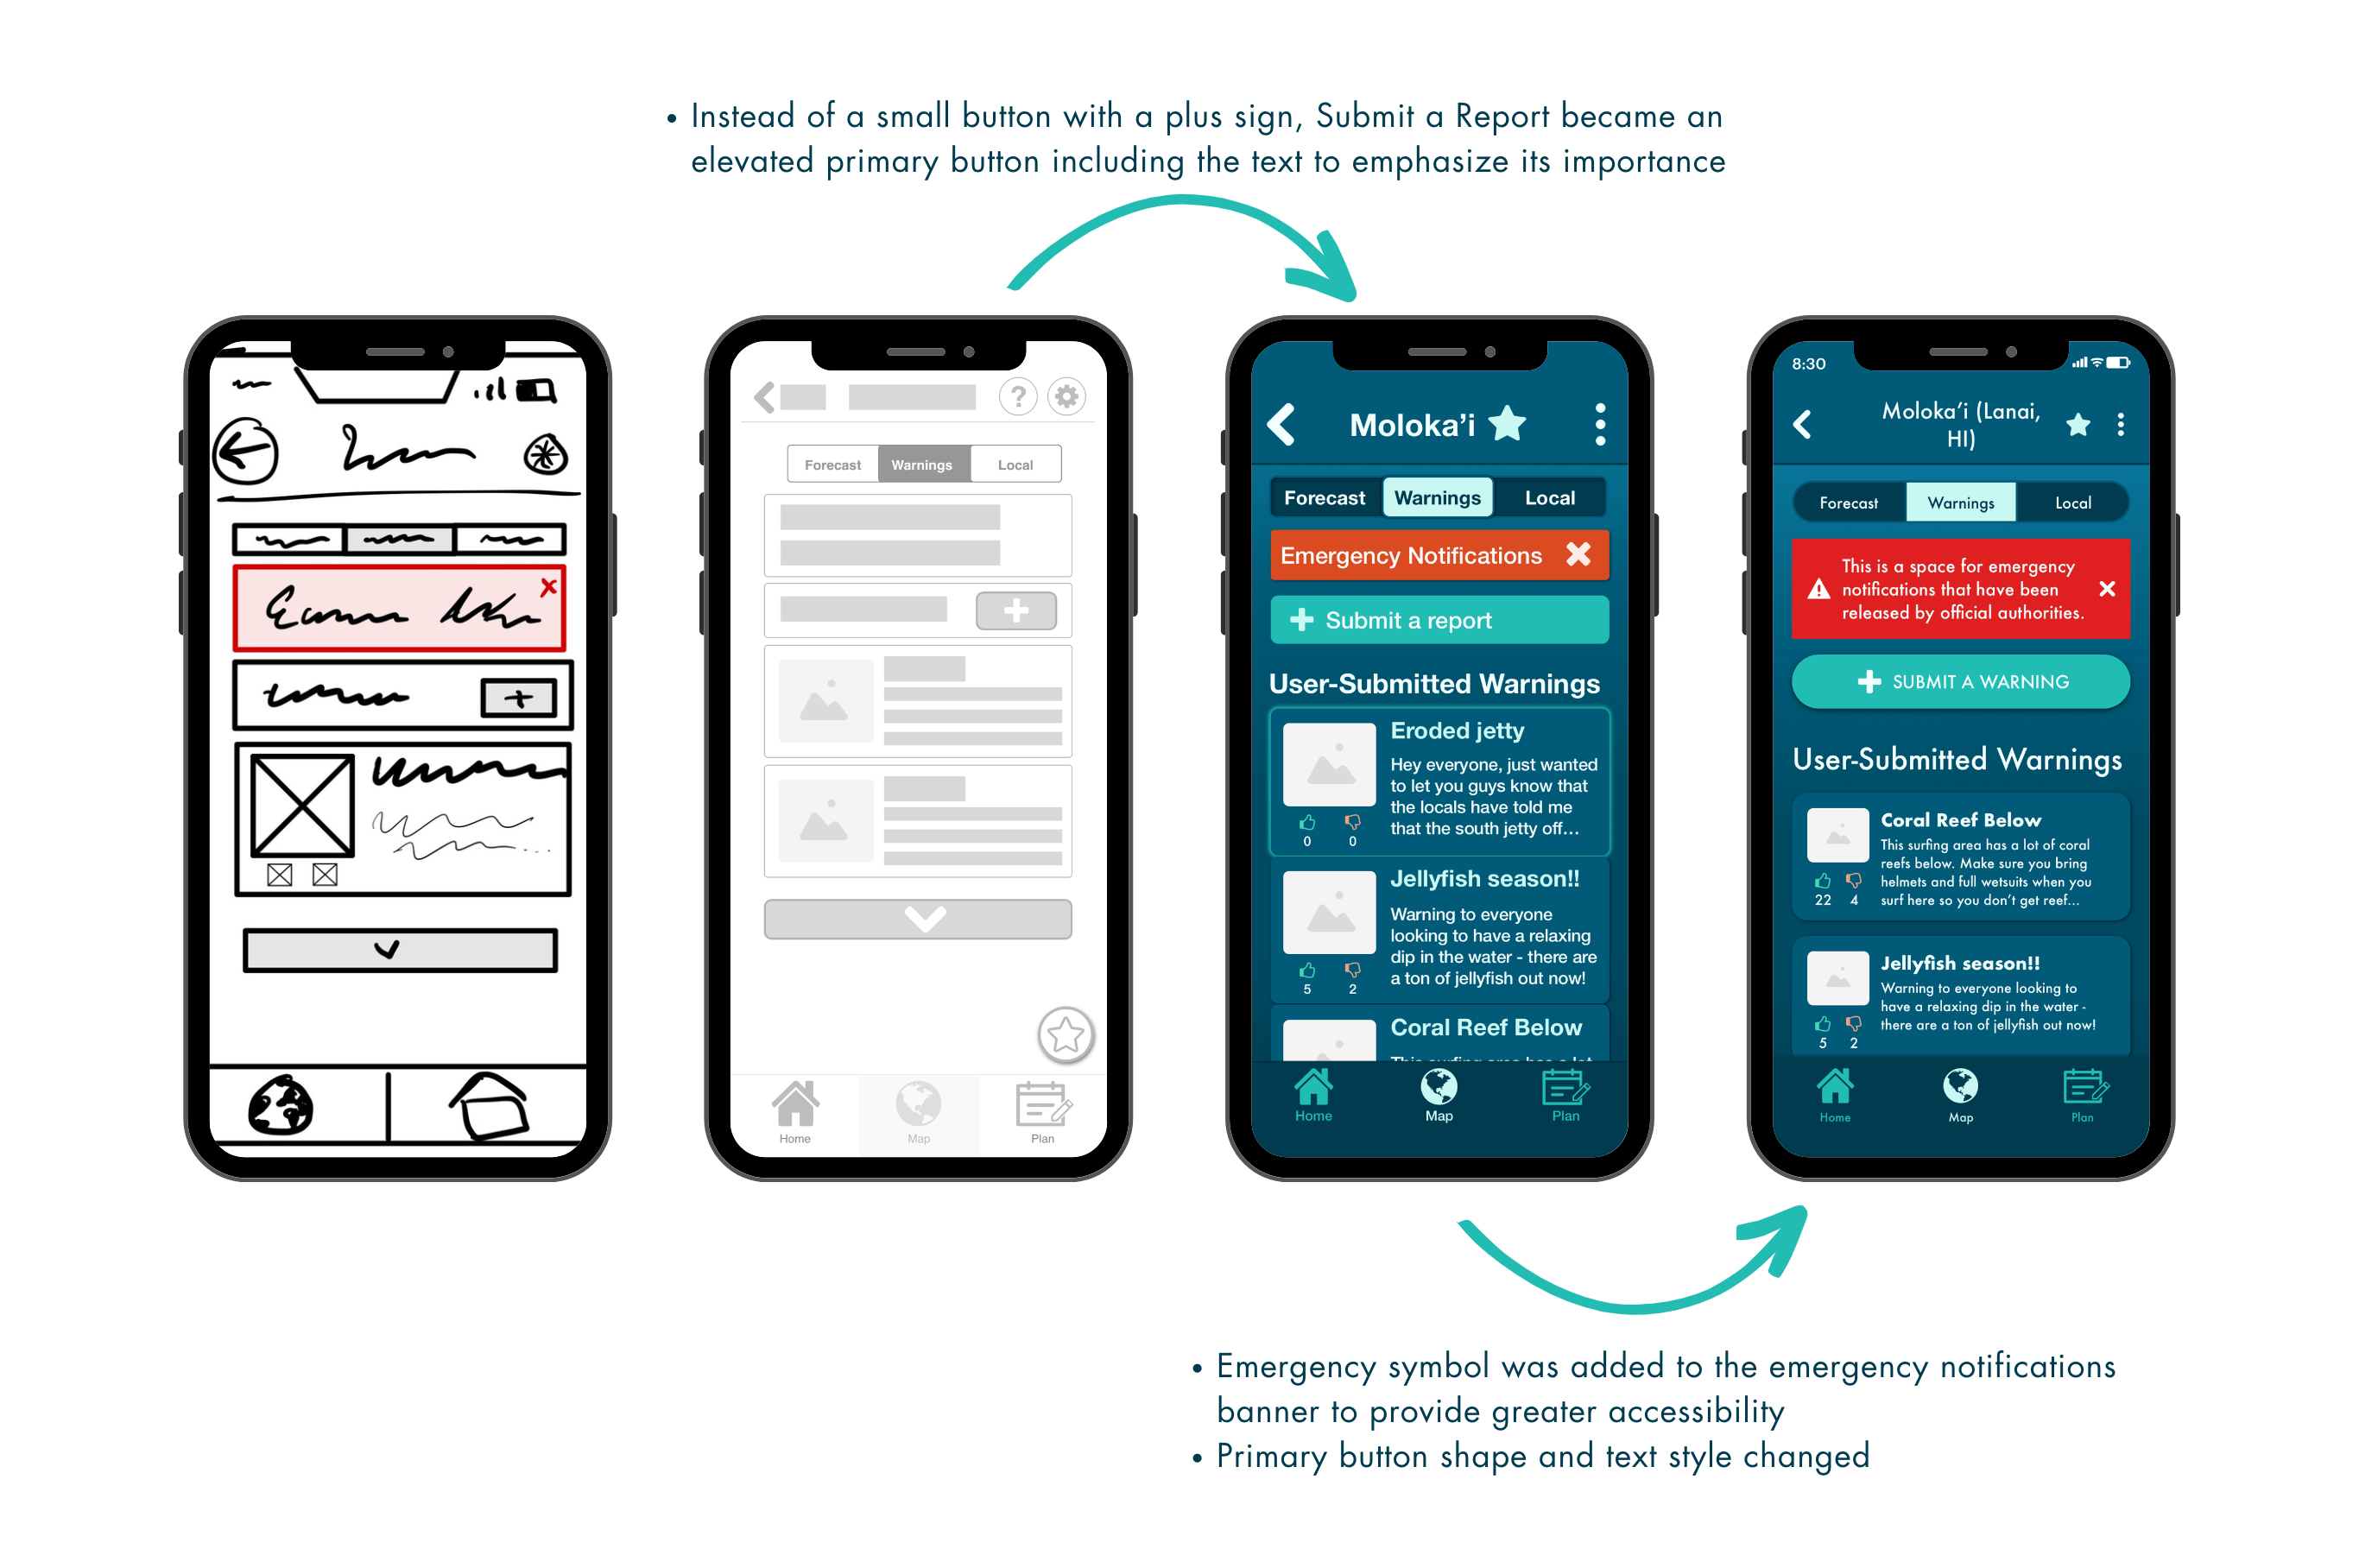
Warnings
The Warnings page was created to help users discover more about the location, address safety concerns, and keep users updated on weather emergencies.
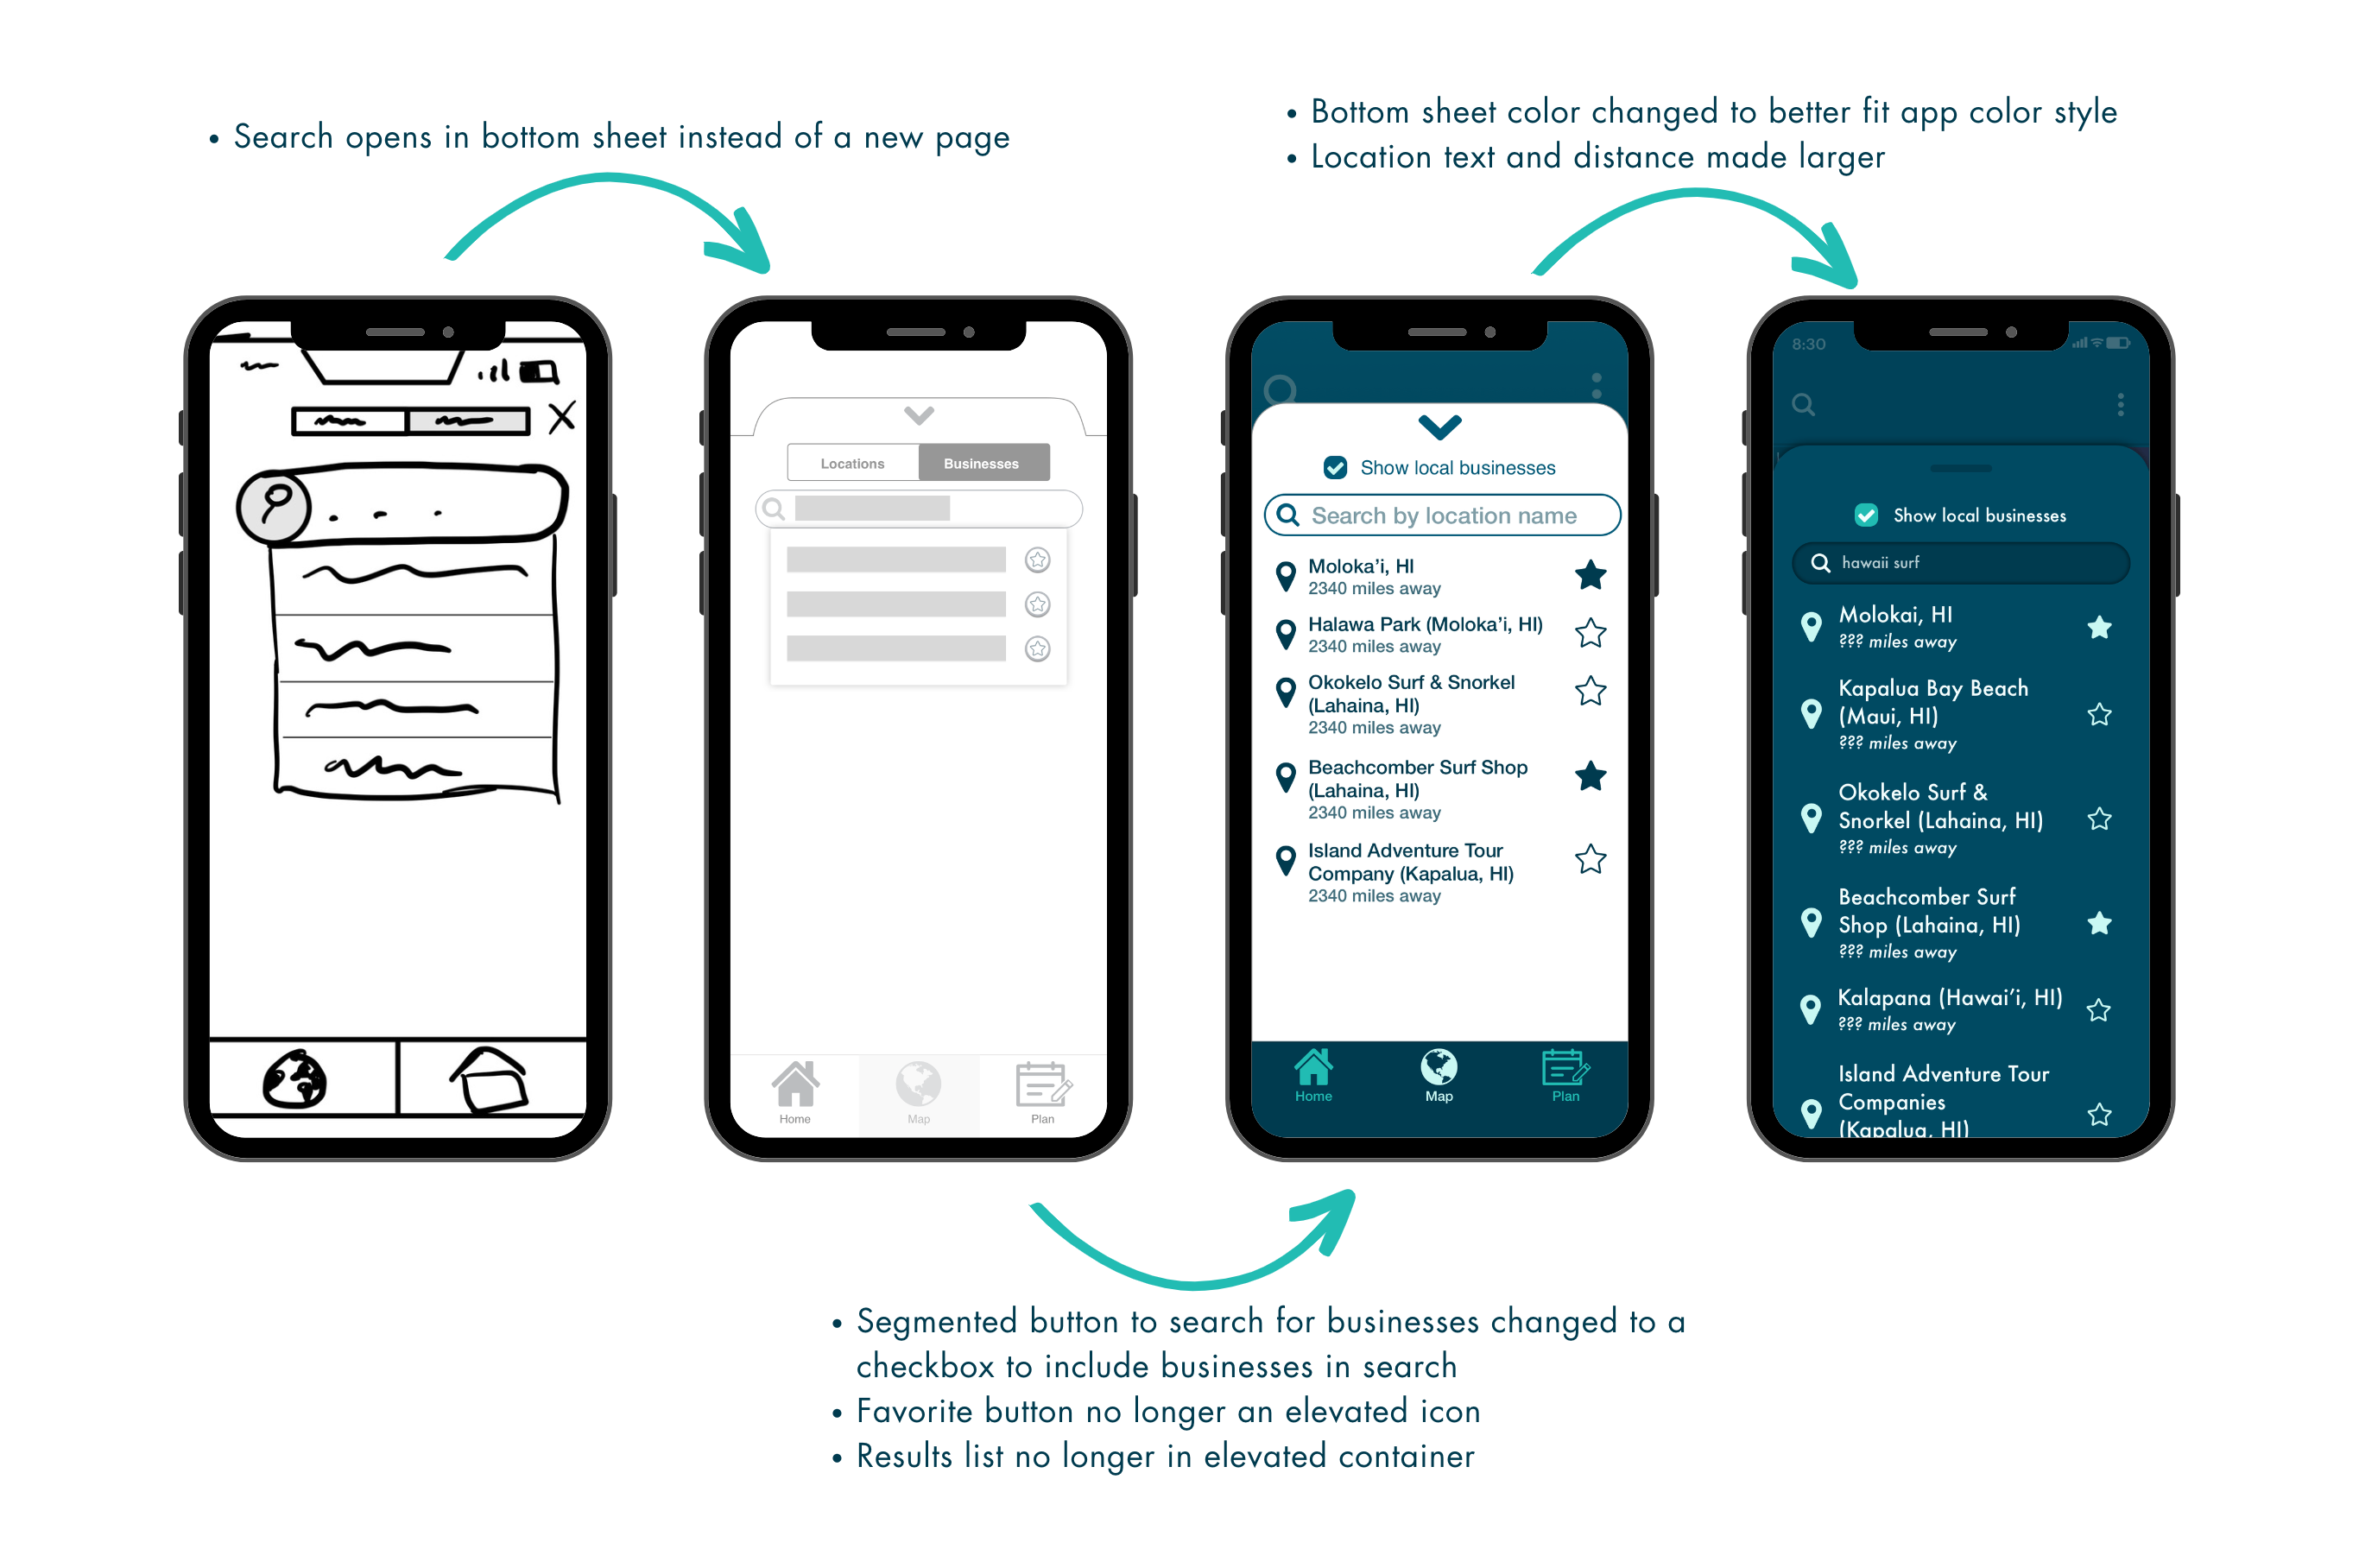
Search
The search feature is designed for users to be able to quickly and easily find a location they are searching for, whether it's a beach, a lake, or a local business.
Plan
The plan feature was originally added as a result of discoveries during user research, in order to provide users with the ability to keep track of multiple forecasts together.
